Erez Katz, CEO and Co-founder of Lucena Research
Searching for Shorts
A prominent portfolio manager once told me; “If you can come up with a method to reliably identify short investment opportunities, you will likely own Wall Street”. Indeed shorting, or betting against a stock, could be very profitable but nevertheless a risky business.
For one thing, shorting a stock presents an asymmetric risk with hypothetical unlimited losses. When buying a stock (or going long on a stock) at $10 per share for example, the most you could lose is $10 or 100% of your initial investment.
Risk vs. Reward in Short Investment Strategies
Shorting a stock is technically selling a stock you don’t own for a current price with the obligation to buy it back at whatever the market price is at a later time. If you were to short a stock priced at $10 today and the price of the stock moves higher to $200 per share, you will be obligated to pay $200 for each $10 investment. Losses equal to $190 per share, 19 times (or 1900%) of your initial investment.
Fortunately, most brokers will not allow you to accumulate such losses and will force you to liquidate your short position in order to maintain certain margin requirements. A short squeeze is normally a situation by which large short interest in a stock is forced to close (liquidate) at market price. This type of rush to closing large short positions inherently creates excess buying pressure on a stock, forcing it to move even higher against the short holders.
Short moves are inherently larger and quicker than long stock price appreciations. They present compelling opportunities for quick profits for those able to endure high risk and volatility in their investment. NY Times bestseller “The Big Short: Inside the Doomsday Machine” by Michael Lewis, addresses hedge funds enjoying great profits by effectively identifying shorting opportunities.
Why is it so hard to find short selling opportunities?
Betting against a company is unpopular primarily because it is counter intuitive but more so because it can be perceived unpatriotic, as if you’re betting against the American economy. The reality is that companies are not normally eager to advertise difficulties and setbacks. They are, however, quick to promote their success.
In most short opportunities, a company’s bad performance is either already baked into its stock price or would come as a complete surprise with a dramatic and quick price correction to follow. Bottom line, short opportunities are hard to foresee and even harder to react timely.
How can you beat the odds in identifying short investment opportunities?
By utilizing quantitative analysis science. You can read more about how to Measure Your Data Before Risking Capital.
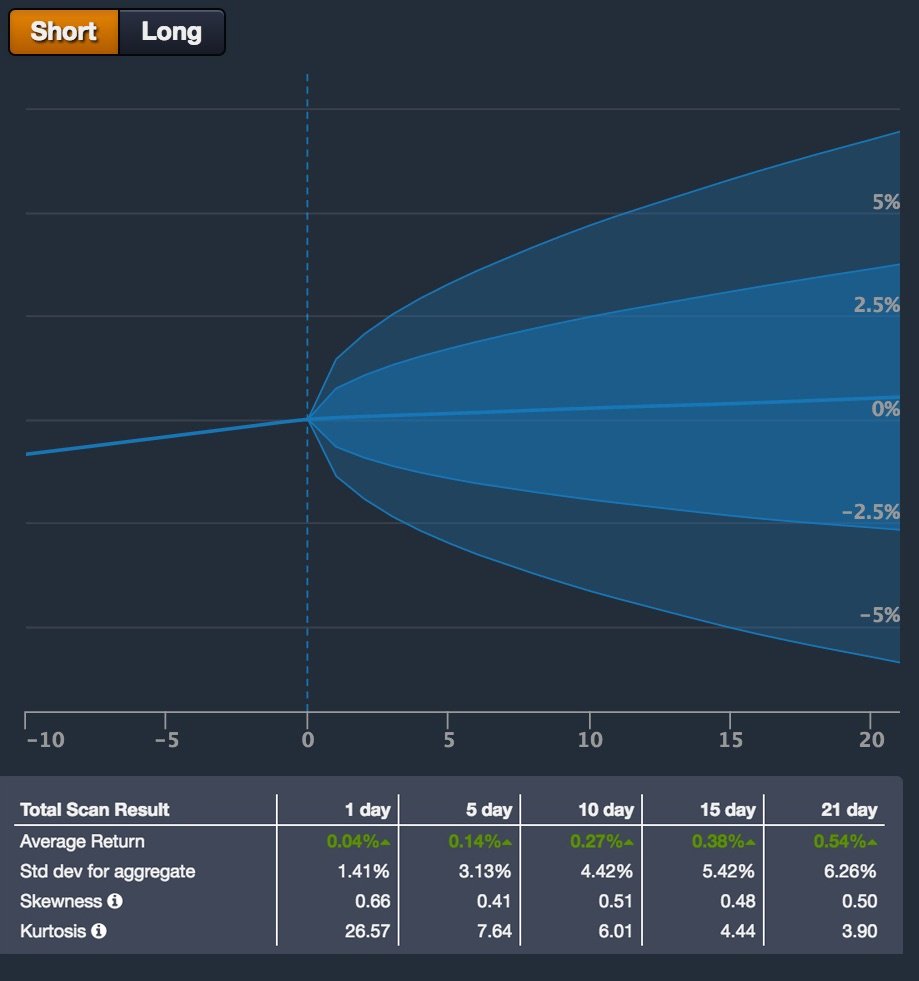
Let’s start with a simple common belief: a stock priced below its 200 day moving average is a sign of weakness and is an indication of a grim near future. By using a platform, Lucena’s QuantDesk Event Analyzer for this example, we can easily confirm or refute such a common hypothesis. Let’s roll back time and see if historically the theory above holds by conducting two event scans in 2010:
- Assess the one-month price action of all the stocks in the S&P 500 when their price was above their 200-day moving average.
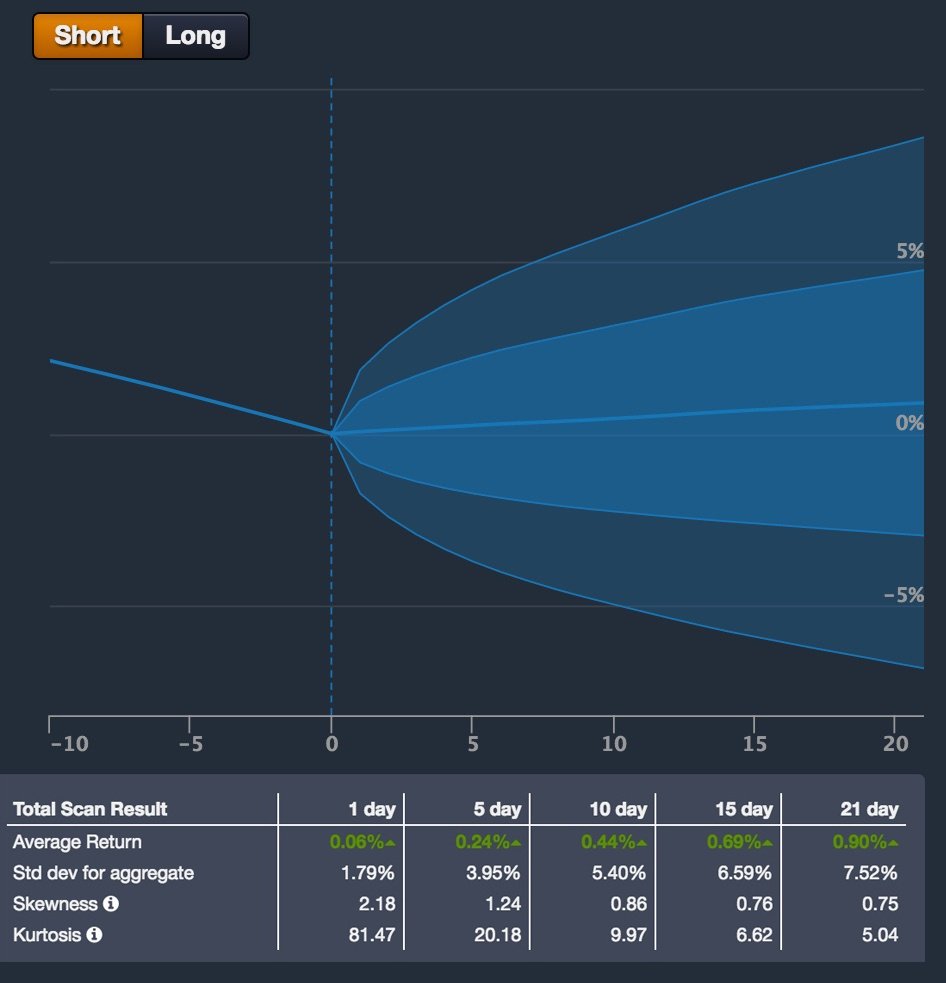
- Assess the one-month price action of all the stocks in the S&P 500 when their price was below their 200-day moving average.
There are approximately three times more up than down moves, but the average market- relative change 21 trading days later (about 1 calendar month) is inconclusive. Both tests yielded a higher 21-day price action. We are looking for situations in which the stock price dropped.
Let’s further qualify our stock universe by looking at stocks with unfavorable fundamentals. How about high PE ratio relative to their peers? We are adding to the scan to include two qualifying attributes:
- Price action for stocks below their 200-day moving average.
- Above average PE ratio.
11,072 additional events during 2010. Average price move 21 days later 1.02% above the S&P 500. This is surprisingly even higher than our previous scan.
We just refuted two common market beliefs! Now let’s put some science to work.
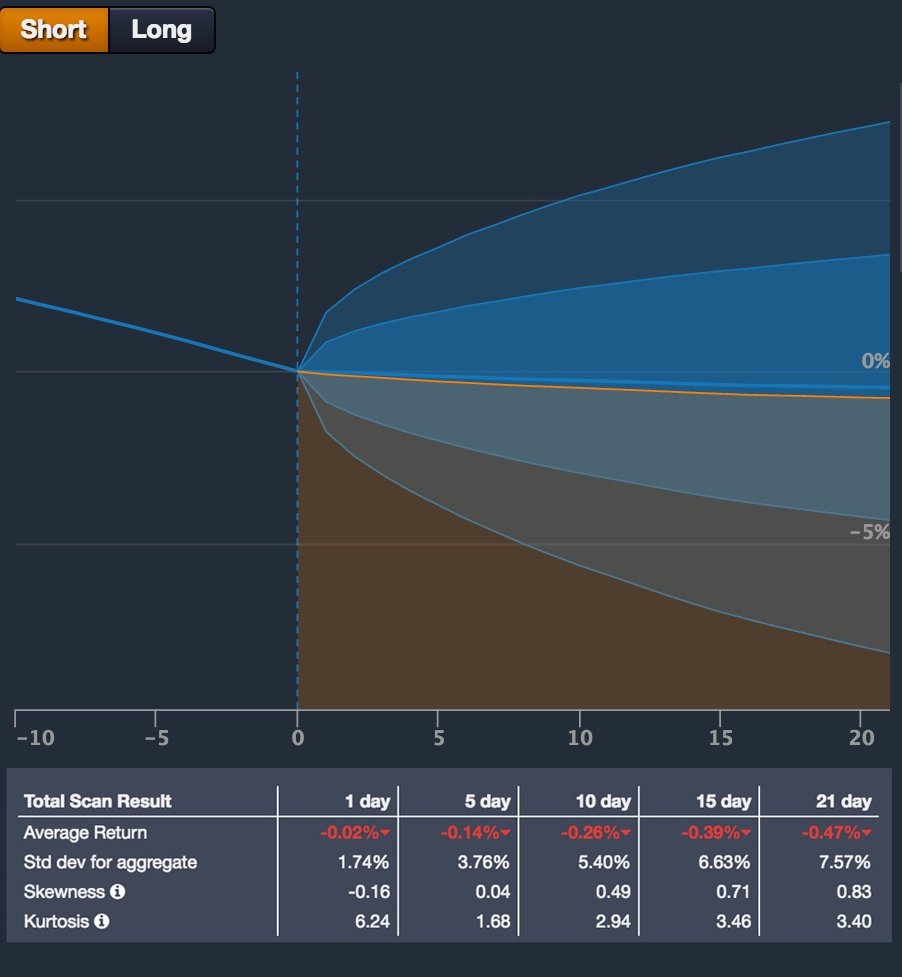
What if we add more screening conditions (or factors) to better classify a downward price action? In QuantDesk you can apply a unique classification technology to recommend additional screening conditions from our over 900 factors to indicate a downward price move.
With the new recommended SMA 100-day momentum change, we now have more favorable results: 4,165 events during 2010. Average price move is -0.47% 21 days later below the S&P 500. We finally have a high concentration in a lower price action following a well-defined condition
Key takeaways about short investment strategies:
Although the results are encouraging, they reflect specifically what happened in 2010. It’s critical to assess how the screening conditions hold during other time periods (2011, 2012, etc.). In Quant lingo, this is called “an out of sample assessment.” If the conditions indeed hold, this could very well be the basis for a short trading strategy.
There are quite a few other important considerations (cross validation, robustness assessment, backtest simulation and more) to factor in to truly validate your investment strategy before deploying and risking capital.
Betting against a stock whether through short selling or Options can be very effective but extremely risky. To truly identify a short only strategy you need to incorporate a self-adjusting quantitative model, team up with a reputable company that can provide not just signals (in a black box), but uncover the most influential considerations contributed to the decision making process. More about some of our current short strategies that use alternative data here.
Read Next: The Benefits of a Multi-Strategy Investment Approach
Find out more about our AI driven investment strategies.


