Erez Katz, CEO and Co-founder of Lucena Research
Best Practices Geared to Test the Robustness of a Quantitative Investment Strategy
So, you have an outstanding investment approach ready to be tested with real money. You’ve followed best practices, avoided overfitting (or curve fitting), validated your data sources and ensured it is survivor bias free, your backtest is completely out of sample and you’ve even accounted for transactions cost and slippage.
But very quickly after going live you’re scratching your head and wondering if you are just the unluckiest person on earth since the strategy’s live performance does not look anything like the backtest! What happened?
Set Expectations for Your Machine Learning Model
It’s important to clearly identify what constitutes deviation from expected performance to improve your model performance. In many cases, a perfectly sound strategy is looked upon as disappointing and thus abandoned prematurely. Here is an example:
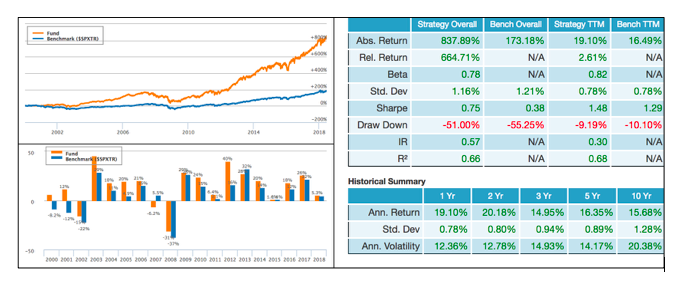
Even such a strong performance can be subject to a protracted period of underperformance. Lucena’s backtest report provides additional information above and beyond the year-over-year total return performance. It’s important to set realistic expectations based on the backtest’s guidelines. Here is a look at additional information from the backtest performance report.
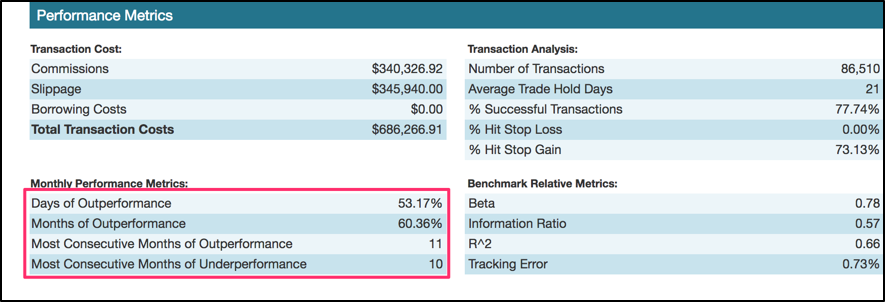
The strategy measures ten consecutive months of underperformance against its benchmark and in spite of this temporary lull, it was still able to handsomely outperform the benchmark by more than 664%!
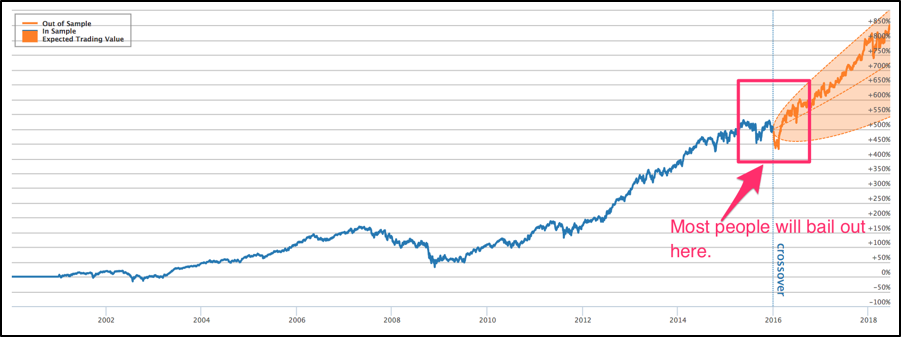
One of the ways to make your validation strategy more robust and visually identify if the live strategy performs in line with expectations is the crossover report, which shows an expected performance cone based on the backtest’s recent volatility and drawdown.
Data Validation / Data Normalization / Proper Labeling
There are several important disciplines that will contribute to achieving consistent performance after the backtest period. I’ve already described how important it is to validate the data on which the models are based.
For example, if a sentiment score uses future knowledge in the construction of the signal, the signals themselves would be clearly invalid since their values were retrofitted based on what transpired after they were originated. In addition, it’s important to test for survivorship bias and still consider delisted or dead stocks.
Below is an excerpt from a data validation report we generate before considering a new data source for a strategy. The validation process is designed to measure the authenticity and potency of a big data signal.
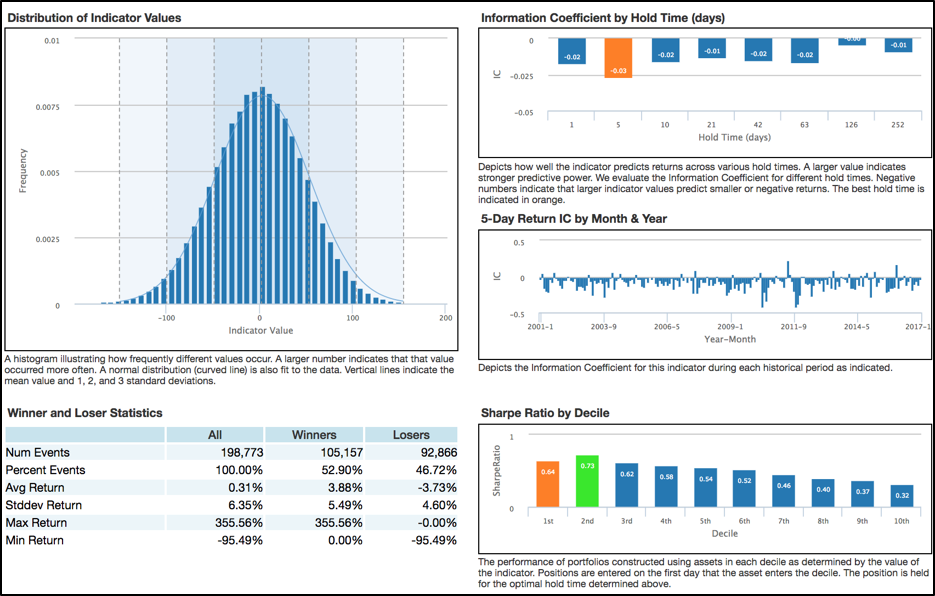
In addition to validating the data, it’s important to present the signals in a normalized fashion to ensure it remains relevant over time under different market conditions.
For example, rather than looking at a signal’s absolute value (number of tweets 1,254,000) we may want to normalize the signal as a value between 0 and 100 or 0 and 1 (with fractions in between). We may want to measure the percent of tweets above or below a rolling mean and how that percent change compares to a universe of peers.
How to Normalize Values
There are plenty of known methods to normalize disparate values. For example, Z-score measures how many standard deviations a measurement is from the universe mean. It takes the distribution of all signal values during a specified period and measures how a single value is positioned relative to others.
In deep learning, labeling data is the process of providing the machine with empirical examples of the desired outcome or the objectives we want the machine to train its model towards. A deep net model uses such labeled data to “learn” by which it attempts to minimize the distance between the model’s output and the desired (labeled) output. The method by which labeled data is generated should also be normalized in order to maintain relevance during multiple market regimes.
For example, rather than training the machine to identify stocks that will rise by 2% or more in the next month, perhaps assigning a more dynamic price target based on the stock’s idiosyncratic behavior. How about classifying a label as 1 (desired) if the price of the stock reaches the upper bound of its average true range (ATR) within a month?
Hyper Parameters Search and Cross Validation Can Lead to Selection Bias
One of the biggest mistakes that I have seen professionals make is subjecting their models to selection bias. There are many parameters that could ultimately determine the makeup of the model used by a strategy. Take, for instance, a convolutional neural network model (CNN).
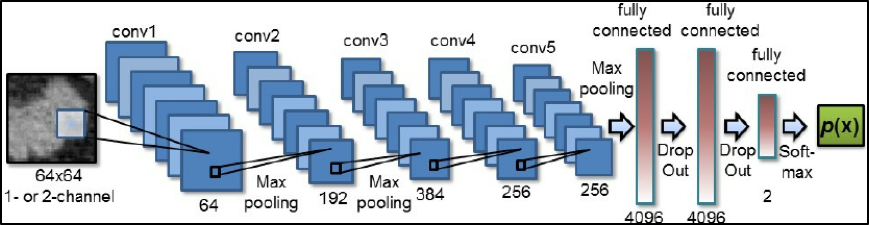
- What size image should be used?
- How many hidden layers?
- What kernel size should be used for image filtering/transformation?
And the list goes on…
A grid search assesses the potency of each combination of parameters in order to determine which configuration is best suited for deployment. A typical grid search can take days, even weeks. A hyper-parameter grid search goes through many thousands of configurations by which it assesses the robustness of each potential model. Typically, the evaluation goes through many subperiods of training and testing, a process known as cross validation.
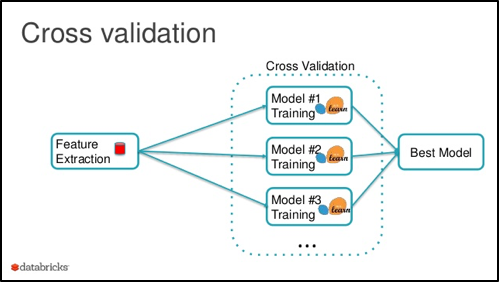
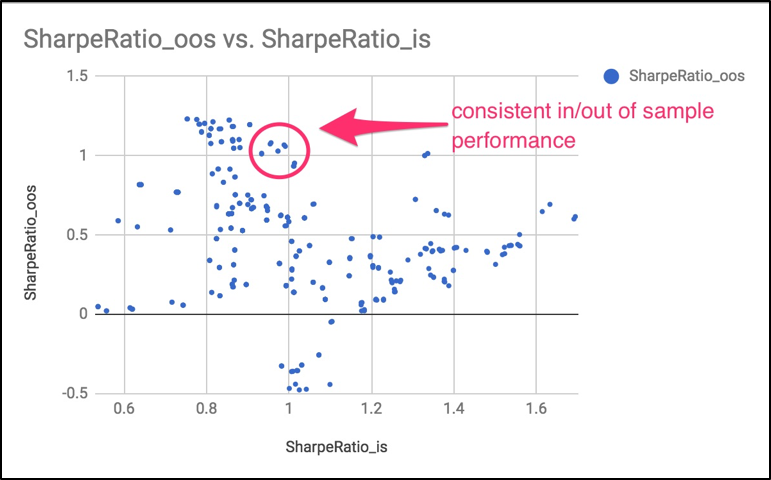
A typical cross validation strategy is done over a predetermined time period broken up into many consecutive sub time-periods of in-sample training paired with out of sample testing.
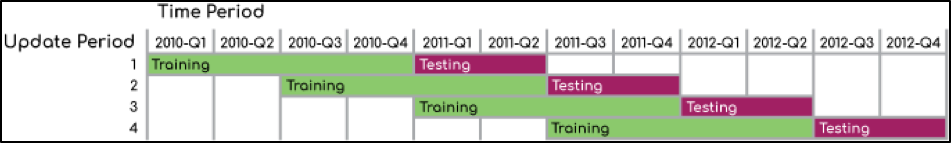
At the conclusion of the in/out of sample testing, we can determine which model consistently performed well both in and out of sample. Although all final backtests were done out of sample, the selected model is not yet proven robust and ready for live trading. This is because the grid search as conducted makes our model subject to selection bias.
By trying many thousands of iterations, we are not really testing our model out of sample per se. It’s imperative to ultimately take the selected model and test it against a holdout period — a period of time that has never been “seen” before. We then have one shot to see if the model continues to perform well.
Failing to conduct this last final assessment would create an illusion of an out of sample backtest but without a true holdout validation, our model is still unproven and could potentially fall short when tested live.
Why is a robust model crucial to your deep learning strategy?
A robust model is a model that survives the test of time and continues to perform past its backtesting period.
Dynamic models that adjust to both idiosyncratic and regime changes are less susceptible to overfitting but require a higher degree of skills in both data validation and deep learning research. Dynamic models that are able to retrain themselves are more suitable for the turbulent nature of the stock market.
Want to learn more about our deep learning strategy for stock forecasting?