Erez Katz, CEO and Co-founder Lucena Research
How Cross-Validation and Grid Searching Strengthen Your Model
First and foremost, machine learning models geared to exploit complex multi-factor relationships are hard to identify and evaluate. These complex relationships are usually short lived and don’t carry their value well into the future.
The good news is that with recent advances in deep learning and quantitative investment research, non-linear relationships between factors in a predictive model are totally exploitable. One needs to be cautions however, just as in the famous quote from the Spiderman comic books: “With great power comes great responsibility”.
Learn more about our deep learning research to extract signals from alternative data.
With the evolution of A.I. and predictive analytics, I think it’s important to discuss best practices when conducting hyperparameter tuning and feature selection. Specifically in hyperparameter tuning or optimization, many misinterpret compelling backtests when in fact they are unsustainable due to overfitting or selection bias.
What is Hyperparameter/Grid Searching?
Hyperparameters are guidelines of a deep learning model structure. These guidelines must be set before embarking on the model training process which precedes the testing or validation phase.
At a high level, the process of deploying a machine learning model spans four main phases:
- Model construction (hyperparameter tuning applied)
- Model training (hyperparameter tuning applied)
- Model testing (no hyperparameter tuning)
- Model deployment (can be applicable perpetually on a look back period)
Hyperparameter tuning applies to both phases 1 and 2, but should never be used in phase 3.
For phase 1, we are mainly optimizing the plumbing or the foundational structure of the model. For example, how many layers, what activation function should be used, etc. In phase 2, we try to define what are the execution parameters of the model such as how often should we retrain, what are the allocations guidelines, stop loss or target gain goals, etc.
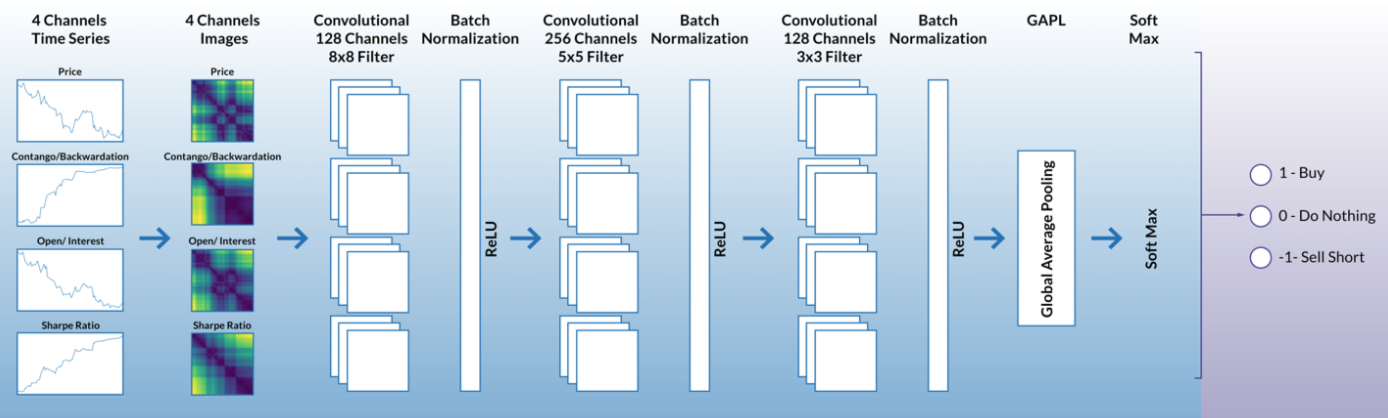
The below image represents an example of deep learning model guidelines that can be refined through hyperparameter tuning. Each layer has multiple elements to be considered. For instance, how many input channels, how large is the image to represent the factors, how many convolutional filters, etc.
Naturally, the number of permutations when considering a product of all these options can be quite large and in many instances a brute force search is not feasible. Bayesian hyper parameter tuning is an efficient way to identify which parameters are best suited for a model without sifting through each and every permutation.
Using grid search to determine trading strategy
Imagine that we want to determine the optimal stop-loss levels for a given trading strategy. Stop-loss is an exit criteria that is geared to minimize losses when a stock or a portfolio moves against its forecast (in our case the forecast is derived from a machine learning process).
Applying a stop-loss too early and causing stocks to exit prematurely could adversely impact a portfolio’s performance. In contrast, a relaxed stop-loss condition would allow the portfolio to accumulate losses if the portfolio’s constituents continue to slide.
Given a period in which we conduct our research (in-sample period) here are three approaches among many:
- 1. Run a backtest and identify which stocks are the winners (exhibited returns above a certain threshold – above 3% for example) and which are the losers (dropped below a certain threshold)? Through running a wide array of backtests, we can identify the average max drawdown of the winners vs. that of the losers. More about the QuantDesk Backtester here.
- For example, if the losers exhibited on average a max drawdown of 5% while the winners exhibited on average a 3% max drawdown, it would be plausible to place a stop-loss at 3% since we know that empirically winning stocks, on the average, did not fall below 3%.
2. Conduct a brute force grid search – Preselect a series of stop-loss conditions from one to twenty incremented by 1% (1%, 2%, 3%… all the way to 20%). Then run 20 backtests on the same in-sample data set to empirically identify which stop-loss produced the best results.
3. Dynamic Labeling (preferred way) – Conduct a more dynamic grid search by which we define the bounds of a stop-loss/target-gain based on each asset’s specific volatility characteristics. In our case we use ATR (average true range) as a measure of volatility.
Below is an example of a dynamic label by which the size of stop/loss target gain cones are idiosyncratic and asserted based on the asset’s specific volatility characteristics.
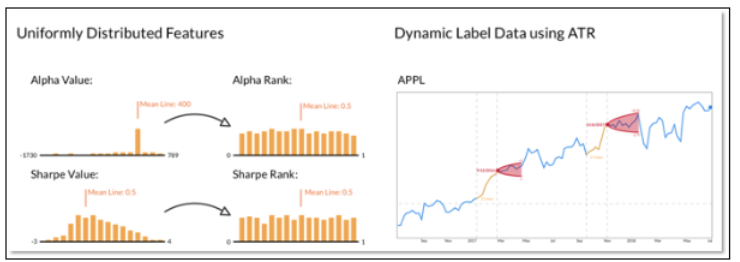
The above example is an oversimplification of real world research because stop/loss is only one factor in a complex set of rules for an algo-trading strategy. Dynamic rules of a strategy’s execution are less likely to overfit but make the exploration through hyperparameter tuning more complex.
For example, depending on market conditions a stop/loss level could be set at 4% for one period and 6% for another. The criteria for best results doesn’t have to necessarily be the backtest with the highest total return.
Here is why: Imagine that our grid search identified one stock that if purchased in the beginning of the backtest and held throughout the entire testing period, would produce the best return. Many would find the results unsubstantiated (or not likely to repeat) due to a lack of statistical significance.
Scoring grid search results: fitness function
A fitness function would normally contain a set of rules that together score the strength of the grid search results.
Below are some parameters of a fitness function, but there could be a lot more:
- best total return
- best Sharpe
- most diversified
- longest average hold time
- most liquid stocks
In addition, not all factors in a fitness function are weighted equally. Perhaps best Sharpe is more important than most liquid stocks. Therefore, the fitness score would normally take into account different grades of significance to score a strategy’s outcome.
In reality, a grid search can conduct many thousands of backtests to exhaustively test all permutations of all the rules and their possible values. At the conclusion of this exhaustive search, the backtests are ranked based on their fitness score.
Data mining fallacy – the dangers of misusing a grid search
With a granular grid search it is easy for novice researchers to find a model that fits a predetermined fitness function. With an exhaustive grid search, a researcher is bound to find something that will look outstanding in a backtest and will likely instill a false sense of conviction in an otherwise poorly designed strategy. This is a typical example of selection bias, curve fitting or overfitting.
More about overfitting and how to ensure your strategy is founded on predictive data.
How to minimize overfitting
There are many techniques used to minimize overfitting, but among the most important are cross-validation and hold out periods.
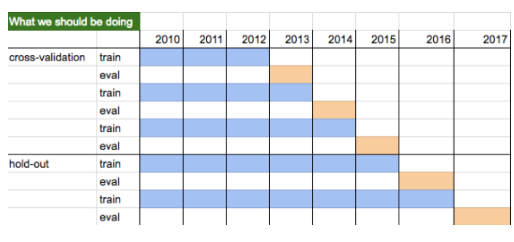
Cross-validation is an iterative process by which the strategy rules are defined through in-sample training and subsequently validated on a different set of data. The ultimate test is to determine if the rules defined during the cross-validation period still hold during a completely new and unseen set of data.
Hold out periods are timeframes that have not been seen or evaluated even during the cross-validation time frame. This is the time frame in which we test if the rules of training and subsequent execution as defined in the cross-validation still hold.
Below is an example of how cross-validation and hold out can be used through iterative research.
The Importance of Dynamic Labeling
Big data and predictive analytics are becoming increasingly popular among investment professionals. It is critically important to understand the mechanics of how the underlying research is conducted and validated.
It’s also just as important to incorporate dynamic labeling into your grid search. With dynamic labels it’s harder to overfit especially when considering rule-based retraining to periodically calibrate the model to new market regimes. Read more about The Benefits of Dynamic Models.
Moreover, conducting many backtests on the same testing period (without validating the model on a completely new hold out period) can still be subject to selection bias. If the researcher blurs the distinction between training, validation, and holdout he/she would most probably overfit and could ultimately make a model look great to the untrained eyes but would most likely be unsustainable when deployed live.
Overfitting is one of the most common phenomena that should be minimized or avoided. A proper cross-validation and hold out policy should be enacted to minimize false optimism from a poorly crafted model. Ultimately, the strength of a strategy can only be truly measured once it is deployed live and measured perpetually, since even the most well intended research could inadvertently insert bias.
Questions about our quantitative investment research?
Contact us or drop a question below.