Erez Katz, CEO and Co-founder of Lucena Research
The Three Phases of Data Validation
At Lucena, our mission is to bridge the gap between validated data and data-driven professionals. Portfolio managers seek reliable ways to efficiently assess and deploy alternative data for investment decision making.
Data providers, on the other hand, are looking for unbiased 3rd party validation and empirical evidence of their signals’ predictability in order to gain credibility in a growingly skeptical market.
Data: The Lifeblood of Investment Decisions
It’s important to note there are quite a few pitfalls data providers and data consumers should be aware of. The reality is whether inadvertently or intentionally, the premise of the data can be misleading and subsequently costly to the unsuspecting consumer.
First, it’s important to separate the narrative from the underlying data. Often, we come across data that represents a unique approach to predicting markets, sectors, or individual constituents. But when inspecting the underlying data, it falls short of the premise.
Take credit card transactions. Imagine you have daily access, both historically and perpetually, to any purchase any consumer in the United States makes. Aggregating such data by demographic profile or geographic location can be very telling about economic trends at the macro level and in certain industries. We can tell by inspecting the purchases of a specific product if it is in the midst of a “hot” growing trend. Naturally, such data can provide valuable insight into the future performance of a market, industry, and individual companies.
Read more about using validated data to forecast KPIs.
Evaluating Data Trends
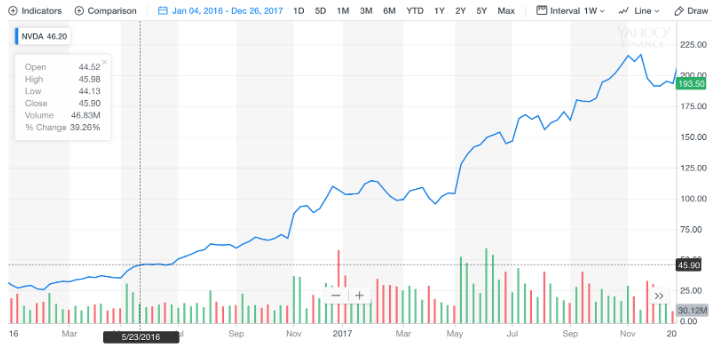
Let’s look at Nvidia (NVDA) for example. Nvidia is a rising star that has capitalized on growing demand for Graphical Processing Units (GPUs). As the GPU market has shifted from a niche segment of electronic gamers into the broader adoption of AI researchers, block chain and crypto currency miners, and data centers, all of which consume GPU chips insatiably.
Nvidia’s stock has been on a tear in the last 3 years, growing exponentially year over year for a total of more than 800%! Source Yahoo Finance.
Using Data To Predict Trends
On the surface, this sounds like an easy win. If we can ascertain the consumption trends of Nvidia GPU units on a perpetual basis, we could potentially forecast Nvidia’s revenue before its earnings announcement. If Nvidia’s price has yet to reflect this growing demand trend, the signal could help an investor enter a position with high confidence of an impending price move.
In the real world however, data is rarely available in such a straight forward format. Data is also rarely available in real time, and the lag could potentially indicate stale data that is no longer actionable. This doesn’t serve investors and portfolio managers who seek to ascertain actionability or reflect how meaningful a trend actually can be.
At Lucena, we’ve developed a comprehensive process by which we aggregate such data and condition it for machine learning research in order to determine how ready it is for consumption and, more importantly, how actionable it is.
Watch: How to Create Unique Data Feeds to Forecast Stock Prices and KPIs
The Data Predictability Process: Consume, Validate, Enhance and Deploy
In order to assess data efficiently, we have developed a set of technologies geared to automate many of the mundane, time consuming tasks of validating and deploying big data. We break our research process to three well-defined steps.
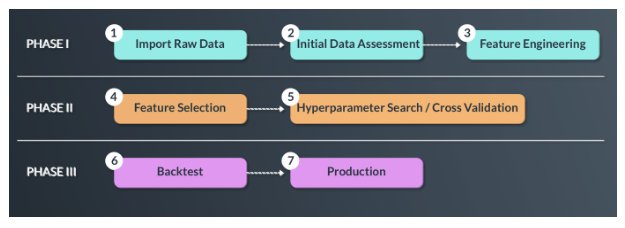
Phase I: Import, Qualify and Feature Engineer Data
In Phase I we conduct research on the entire data sample offered. We test the data for completion, map to assets, extrapolate missing data, adjust for seasonality and aggregate consumption level by channels. Once complete, using our Data Qualification Engine an initial report is generated to qualify and validate alternative datasets’ readiness for quantitative research in the Financial Markets.
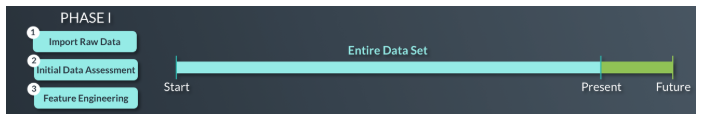
One important step in Phase I is the concept of feature engineering. Feature engineering creates a new set of features derived from the raw data that increases suitability for machine learning time series trend analysis.
For example, we can add a data point that compares the current sales number to a rolling mean of the last 30 days. It’s important to note that in Phase I we are mainly conditioning the data for research, but no Machine Learning discipline is yet deployed.\
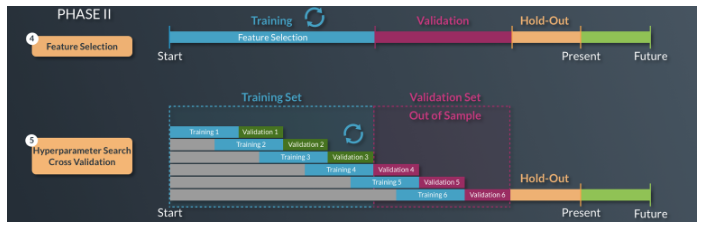
Phase II: Training, Validation and Hold-out
In Phase II we break our data into three distinct timeframes: Training, Validation and Hold-out.
During the Training Phase we construct multi-factor models and assess how strongly correlated these models are to future price actions of certain assets.
The Validation Phase assess the most successful models that show promise from the training phase. In other words, we test the model that was perfected in the training phase on unseen/new data.
This is a highly iterative process by which AI is deployed to repeatedly construct models and test them on a different timeframe.
The Hold-Out Period is designed to ultimately evaluate the data on yet another set of unseen data which we will covered in Phase III.
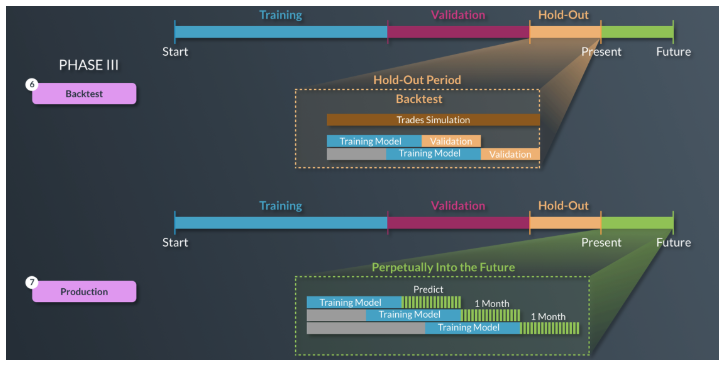
Phase III: Backtest and Train the Model for Future Changes
We test the model that was formed and validated in Phase II on yet another set of unseen data (out of sample). The reason we take this extra step (since we’ve already tested unseen data during the validation period) is that the iterative process of training/validation can lead to a known phenomenon called overfitting, or more specifically, selection bias.
The sheer large number of attempts to test models between two timeframes could lead to overfitting and thus another timeframe is required to conduct one last final test on the most promising models from Phase II.
What is overfitting/selection bias?
With a growing number of variables, if you try and test every permutation, you will likely stumble upon something that looks predictive but cannot be sustainable on new unseen data.
Static vs. Dynamic Machine Learning Models:
Machine learning models for investment should rarely be static, and should adjust dynamically to changes in market conditions. Hence, assessing and retraining predictive models needs to occur every so often. An important side effect of dynamic models is that they are less likely to overfit.
Below is a representation of how we backtest our model on unseen data. We then assess if the signal holds predictive value similar to what was determined during the preceding validation period. The machine constantly assesses for a model’s decay and retrains on more recent data before forecasting again.
Data Matching Engine Report
Data that has passed the three phases of our development process is ultimately made available through our Data Matching Engine (DME). Consumers can enter their constituents list, investment style, time horizon, risk tolerance, etc., and DME identifies through event study technology which data signals are most suitable for their specific needs.
The DME report provides more empirical evidence of how a user can combine multiple independent data sources into a single predictive machine learning model that can ultimately guide their investment decision.
Unlock Your Data’s True Potential
The process of conditioning alternative data for investment is not a trivial one. You need an honest independent partner who can produce empirical evidence of signal correlations to investment decisions.
Moreover, investment should rarely rely on a single set of data, and instead use multiple independent models agreeing on a particular buy or sell signal. Lucena developed a Data Analytics Suite (DAS) to serve as an honest broker to transform data into actionable insights for the financial markets.
Find out more on our data analysis and validation process.


