Erez Katz, CEO and Co-founder of Lucena Research
How A Deep Neural Net Model Predicts An Outcome and Forecasts Asset Prices
First step: Recognition
Deep neural networks are able to classify complex relationships between characteristics of an image and its corresponding classification. These relationships are usually so subtle and deep they exceed what our brains can comprehend.
As scientists, all we can do is control the learning process and assess the outcome, often in amazement. This is one of the reasons we at Lucena find AI/deep learning so revolutionary as discussed in How To Use Deep Neural Networks To Forecast Stock Prices.
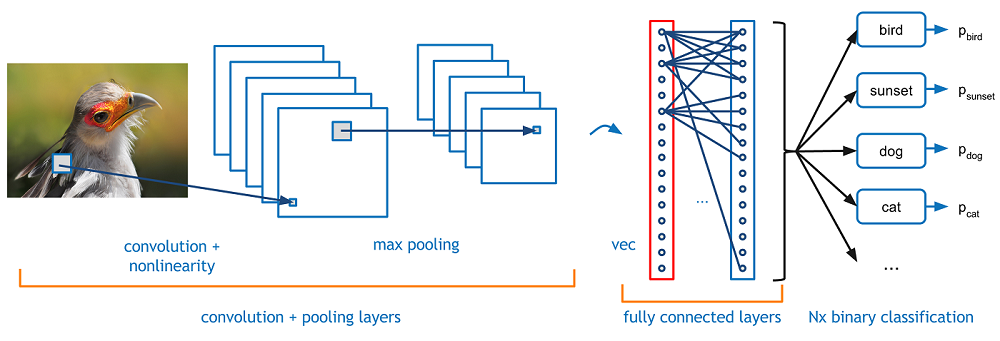
Take, for example, the task of recognizing a bird within an image. The deep learner is able to breakdown the image into a pixelated representation, with thousands of pixels. It sequences the image through receptive fields (convolutional transformation) and is then able to distinguish meaningful patterns (relevant to the bird’s image) from the background.
The following network diagram demonstrates a fairly typical representation of the layers used to accurately classify an object (in our case, a bird) within an image.
A typical learning process feeds a large number of images of birds along with images that do not contain birds. In turn, the convolutional neural network (CNN) “learns” to effectively recognize subtle but distinctive bird-like patterns (such as a beak, feathers or wings) and to distinguish a bird pattern from the broader image representation.
Video: Constructing Unique Data Feeds for KPI and Stock Forecasting
How can convolutional neural networks be used in stock market predictions?
Imagine all the different types of time series data that can be used together to describe the state of a publicly traded company. In theory, we can feed into a convolutional neural network many samples of the company’s state paired with its future price outcomes.
If the network is constructed properly, and the data is indeed predictive, the network will be able to classify “winning” patterns in the past and subsequently recognize new “winning” patterns in the future.
Next Step: Take The Concept Of Time Series Image Representation One Step Further
Predicting future prices based on historical patterns is not new; it’s been occupying investors since the inception of the stock market in 1817. However, since information travels so efficiently, recognizing traditional pattern formations is just not good enough for profit.
The goal of feeding time series data into CNNs is meant to identify complex predictive patterns unrecognizable to the naked eye. This allows investors to scientifically validate an investment algorithm and act on opportunities well before they are exploited by the masses.
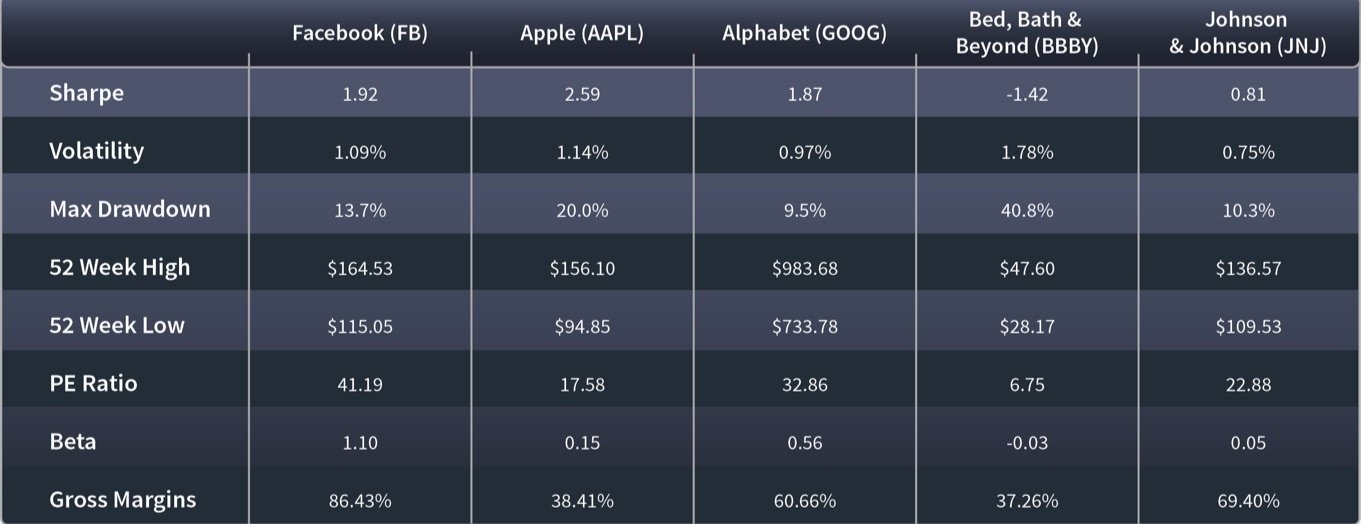
We talked about taking features (also called factors) over time and assessing them daily as they describe the state of publicly traded companies.
Unfortunately, the values above are not conducive to recognizing complex patterns for a few reasons:
- – The data elements are not measured homogeneously: some are in dollars, percentages and fractions.
- – The data is provided as point-in-time values. No trend information is available in the above example. Even if we take the value of stochastics, moving averages and the like which contain historical trend-relative value, the data is still somewhat stale and doesn’t provide enough details for complex image analysis.
- – Each feature value for a given stock is self-contained and isolated. In other words, there is no clear peer-relative measurement.
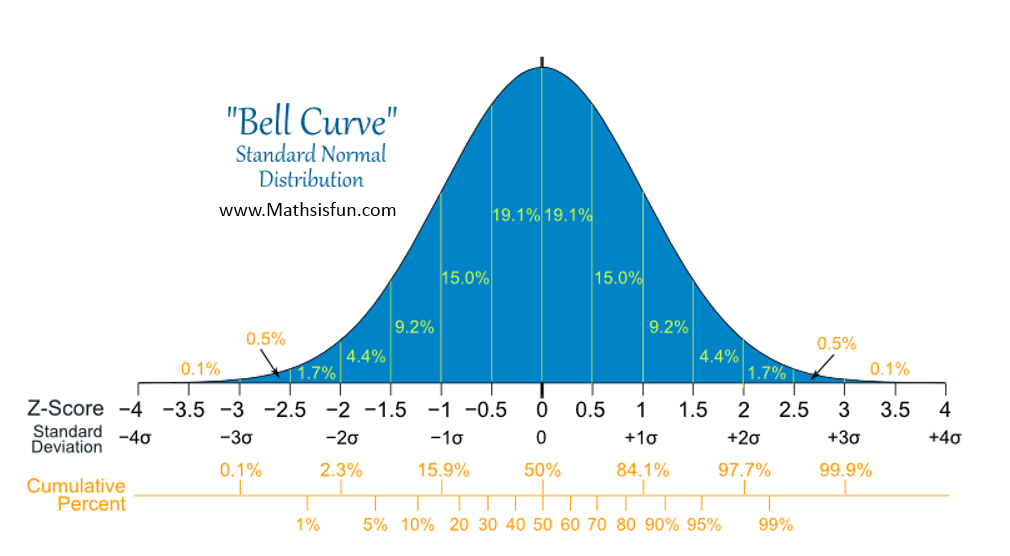
In order to resolve the shortcomings of the raw features data, we have migrated our raw data into a more robust feature set — a process called “feature engineering.” In turn, we’ve created ranked features. So, we have normalized all the values of the features into a Gaussian distribution representation (normally distributed).
Third Step: Assess the historical trends of our ranked features over time
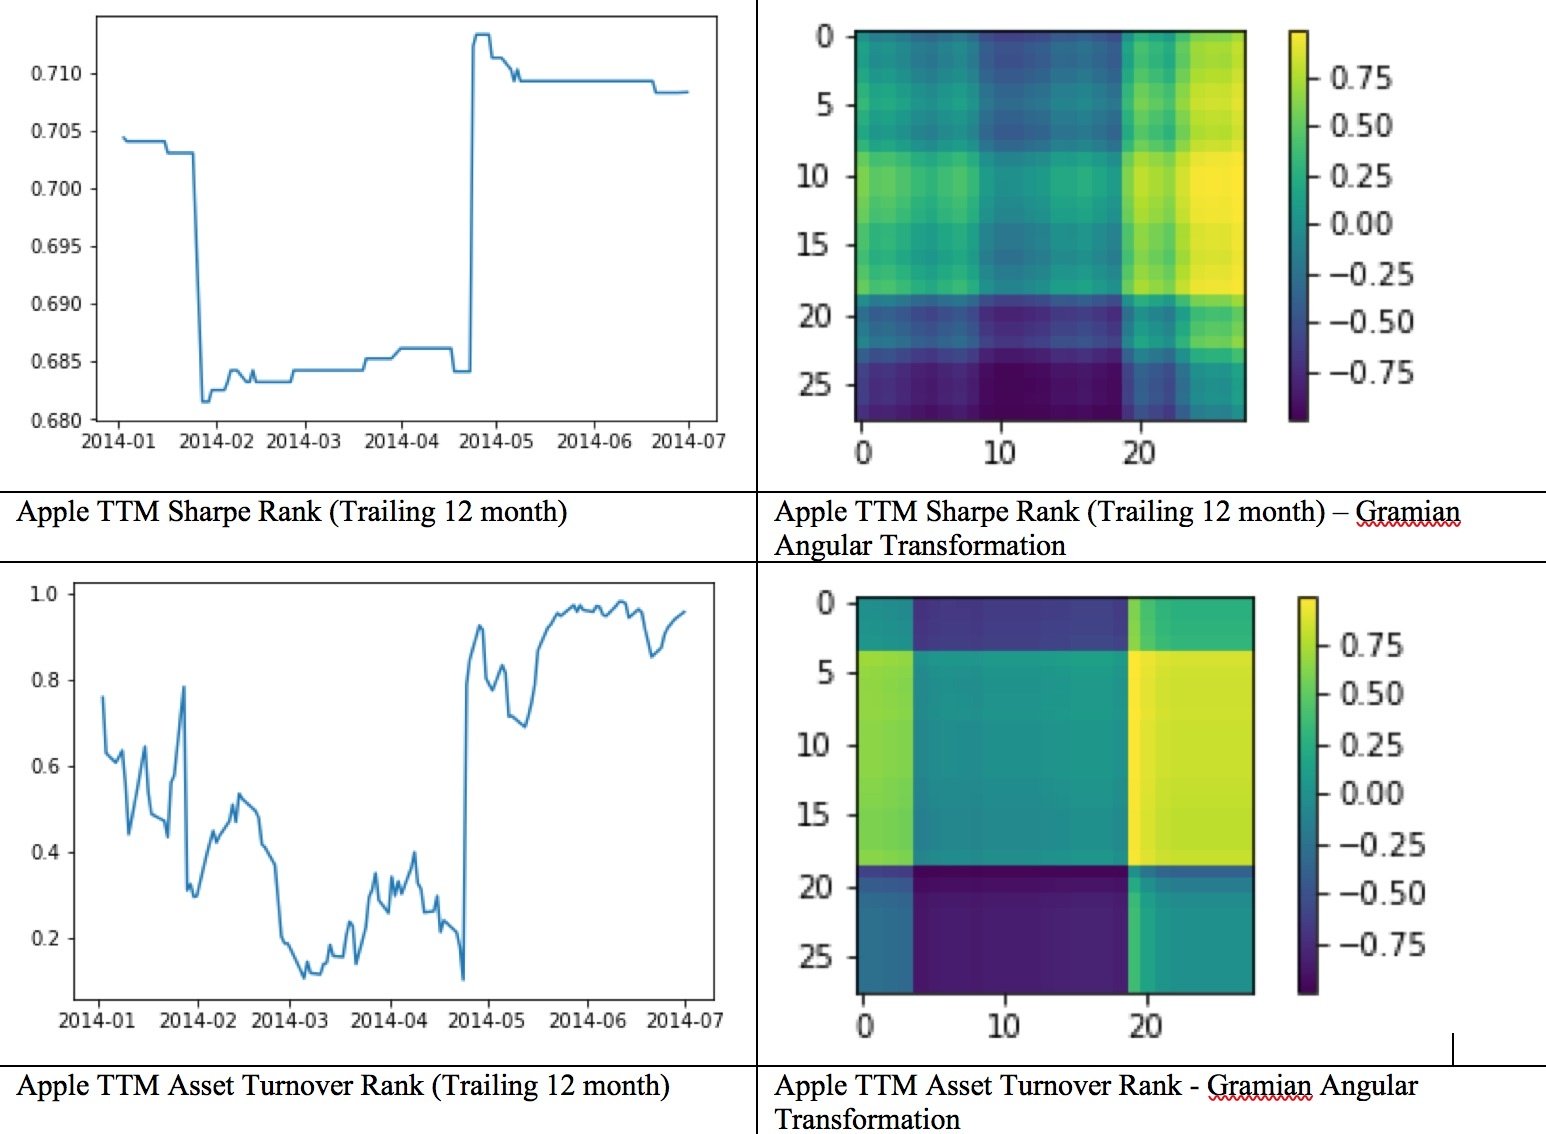
Now that we have ranked each of our raw features, we can tell how Apple’s Sharpe ratio transformed over the last 21 days relative to its peers. Ranked features over time are much more potent than raw features as they do more than provide trend information. The trend is also measured against a company’s peers vs. in isolation.
Final step: Transform the ranked time series features into rich images
Rather than processing the underlying trend graph as the image, we’ve identified a novel transformation algorithm that is much more exciting.
Gramian Angular Difference Field (GADF) is a time series to image transformation algorithm that measures the frequency and sum of the angles of the curves described by the time series by which a flat 1-D data is ultimately transformed into a two-dimensional array.
For more information, please refer to a white paper written by Zhiguang Wang and Tim Oates from the Department of Computer Science and Electric Engineering at the University of Maryland.
Ensure your investment strategy is based on validated data
It’s important to note the algorithm, on its own no matter how sophisticated and effective, is not sufficient enough to achieve a successful outcome. The nature of the data and its inherent predictive power is what ultimately drives the algorithm’s success.
Watch Erez explore the process of extracting and validating alt data signals.


