Erez Katz, CEO and Co-founder
When Lucena began, we started with a machine learning research platform for the “do-it-yourself” researcher. It turned out that some buy-side users were interested in our outcomes rather than the research process itself. Due to that demand, we’ve developed more accessible and “fully baked” products such as Model Portfolios, Smart Data Feeds and big data validation.
Subsequently, we discovered the enormous potential of applying AI and alternative data for KPI (Key Performance Indicator) forecasting.
In theory, fitting a model to historical time series data and forecasting KPIs should be similar to how stock prices are forecasted. In reality, when it comes to forecasting corporate KPIs there are substantial differences in both approach and implementation.
What are KPIs?
KPIs measure the success of a corporation in achieving certain business goals such as growth in sales, number of subscriptions, average price per unit, EBITDA, etc.
There are two types of KPIs; qualitative and quantitative. The latter has no human discretion and is of most interest for quantitative research.
Key performance indicators can be derived from a sequence of historical values for measurement. These raw sets of traditional and alternative data values can be fed into systems designed to aggregate, normalize, interpolate, and extrapolate the raw data into machine learning friendly factors.
There are two types of these factors, “lagging” and “leading,” and both are important for KPI forecasting research. More on that later.
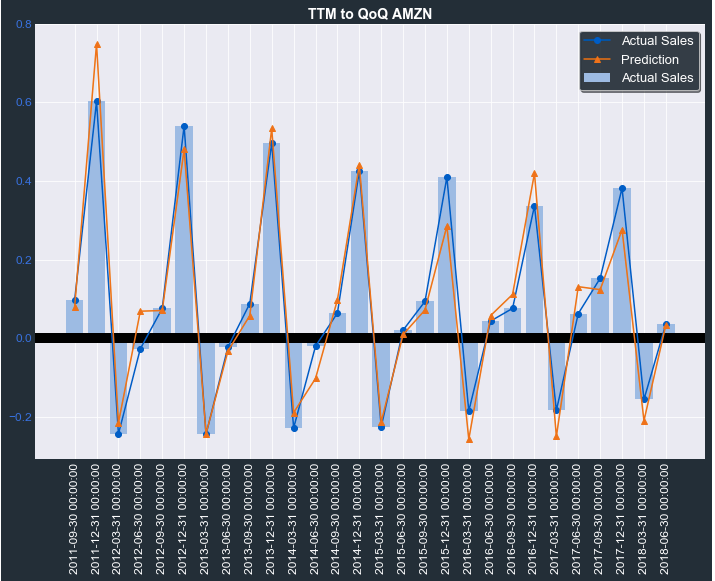
Forecasting AMZN Quarter over Quarter growth in Sales. The orange plots represent forecast while blue represents actuals.
Why are KPIs Important?
Style
Many portfolio managers – fundamental and quant funds alike – prefer to rely on their own internal research for investment decisions. This concept is analogous to restaurant owners who prefer to buy the ingredients for a dish and cook it in-house instead of buying it ready-made.
Leading Indicators
Beyond the operational style aspect, KPIs are excellent early indicators. Because of this, KPIs can be used effectively for stock forecasting by both sophisticated quant funds and fundamental researchers.
Evaluating a company’s supply chain and identifying KPIs early in the chain can give researchers a leg up in forecasting what’s to come before the rest of the market.
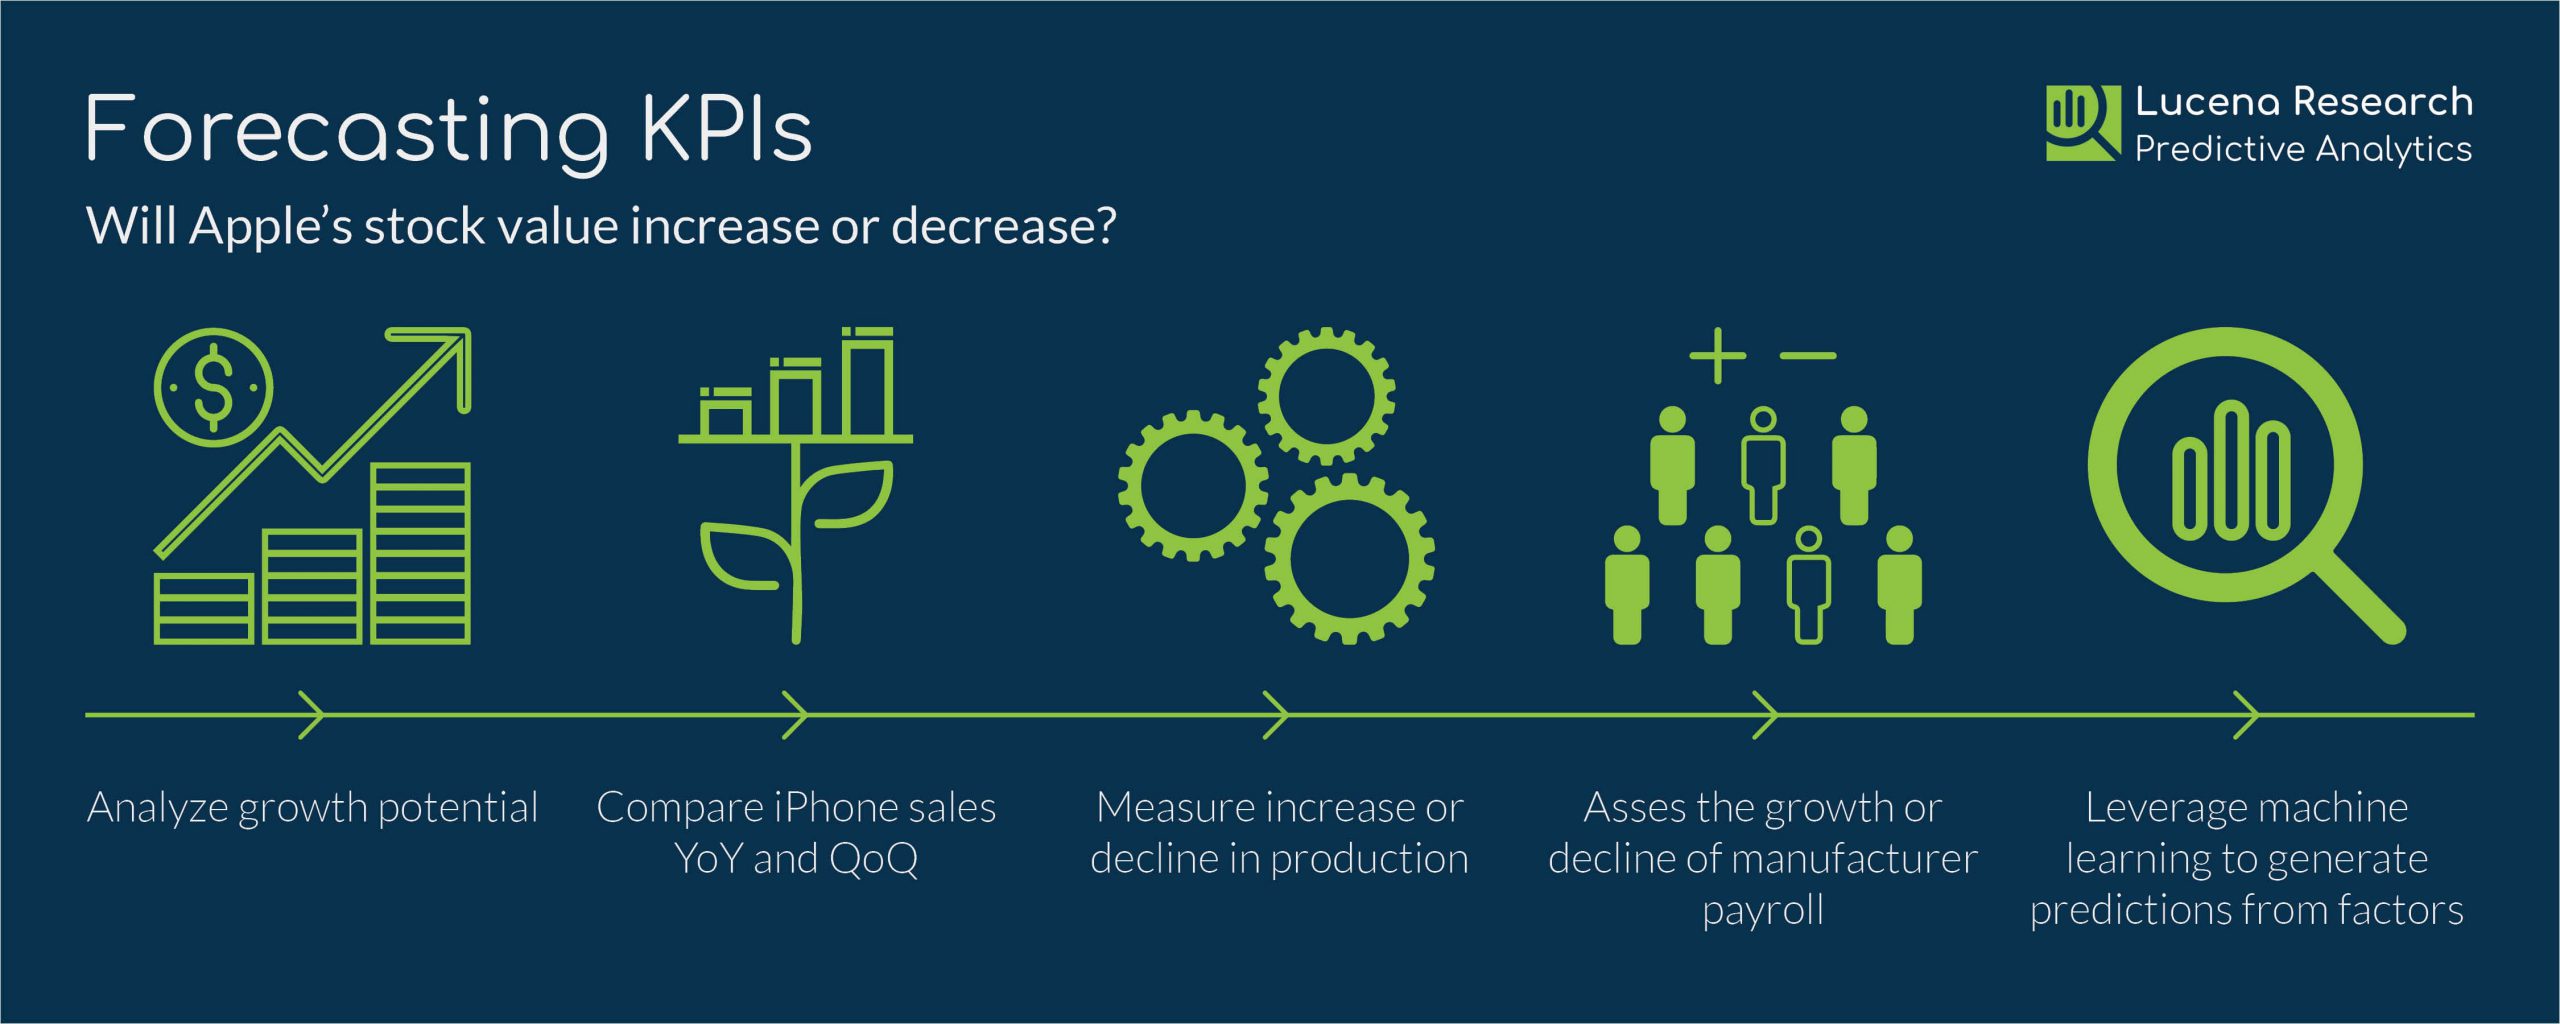
By following the supply chain, we can project AAPL’s stock price as a derivative of:
- Growth in iPhone in sales
- Growth in manufacturer’s production
- Changes in manufacturer’s production personnel
- Changes in manufacturer’s hiring activity
Looking at Apple’s main suppliers’ hiring ads, we can predict future growth in demand for iPhones and subsequently use this indicator as one of the factors to forecast Apple’s stock price.
Accuracy
KPI forecasting is much more accurate compared to price forecasting because the data is typically less noisy and less subject to exogenous factors.
To put this in perspective, when targeting a binary classifier for stock forecasting, we often use the value of 55% as the benchmark to beat. We want to be more right than wrong but raise the threshold to account for transactions cost and slippage. In comparison, it is not uncommon to achieve KPI forecast accuracy in the 80% – 90% range.
Video: Creating Personalized Data Feeds for KPI Forecasting
What are the biggest challenges with forecasting KPIs?
Data Scarcity
The biggest challenge when forecasting KPI is scarcity of training data.
If we attempt to deploy a machine learning regression model, we need an abundance of Y values to train on (Y values are the KPI levels we use for training and subsequently attempting to forecast).
Simply stated, KPIs are often reported quarterly and thus 20 years of historical values would translate to only 80 KPI outcomes. Clearly not enough to train on. This problem is further exacerbated since some of the alternative data sources (such as social media sentiment, internet of things, or even web scraping) only go back a few short years.
Data Staleness
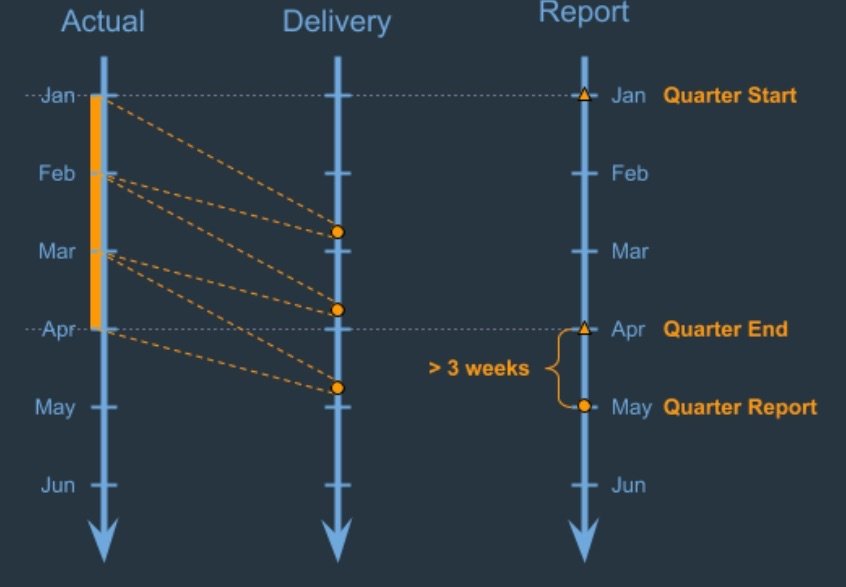
Another major problem with KPI forecasting is staleness of data due to time lag between when data becomes actionable and when it can be can be acted upon.
Often, companies report quarterly corporate earnings long after the relevant quarter has ended. Consequently, many quants wrongly assume that the most recently released data is relevant to the quarter in which it was released. It’s critically important to time training data against the appropriate KPI outcomes.
Data staleness could also suffer from delay in delivery by the source data provider. For example, a data provider that delivers data monthly could delay delivery of the data by up to one month. In theory, by adding both delay in delivery and deferring relevance to the next quarter, we could forecast KPIs based on data that was relevant 4 months ago!
Solutions
KPI’s have a longer term impact
One mitigating factor for data staleness is that in most cases KPIs are early leading indicators of future corporate performance and earnings. It is not uncommon to see a shift in KPIs that affect earnings two quarters or even a year down the road.
Extrapolating and Interpolating KPI outcomes (Y labels)
While alternative data can be published in varied time intervals (daily, weekly, monthly, or quarterly) it is important to translate all data frequencies to the lowest common denominator – daily.
The goal is to achieve distribution uniformity among all data sets. A machine learning regression or a classifier will have a much easier time conducting feature selection and constructing diverse multi-factor models from orthogonal datasets, if all data factors are uniformly distributed.
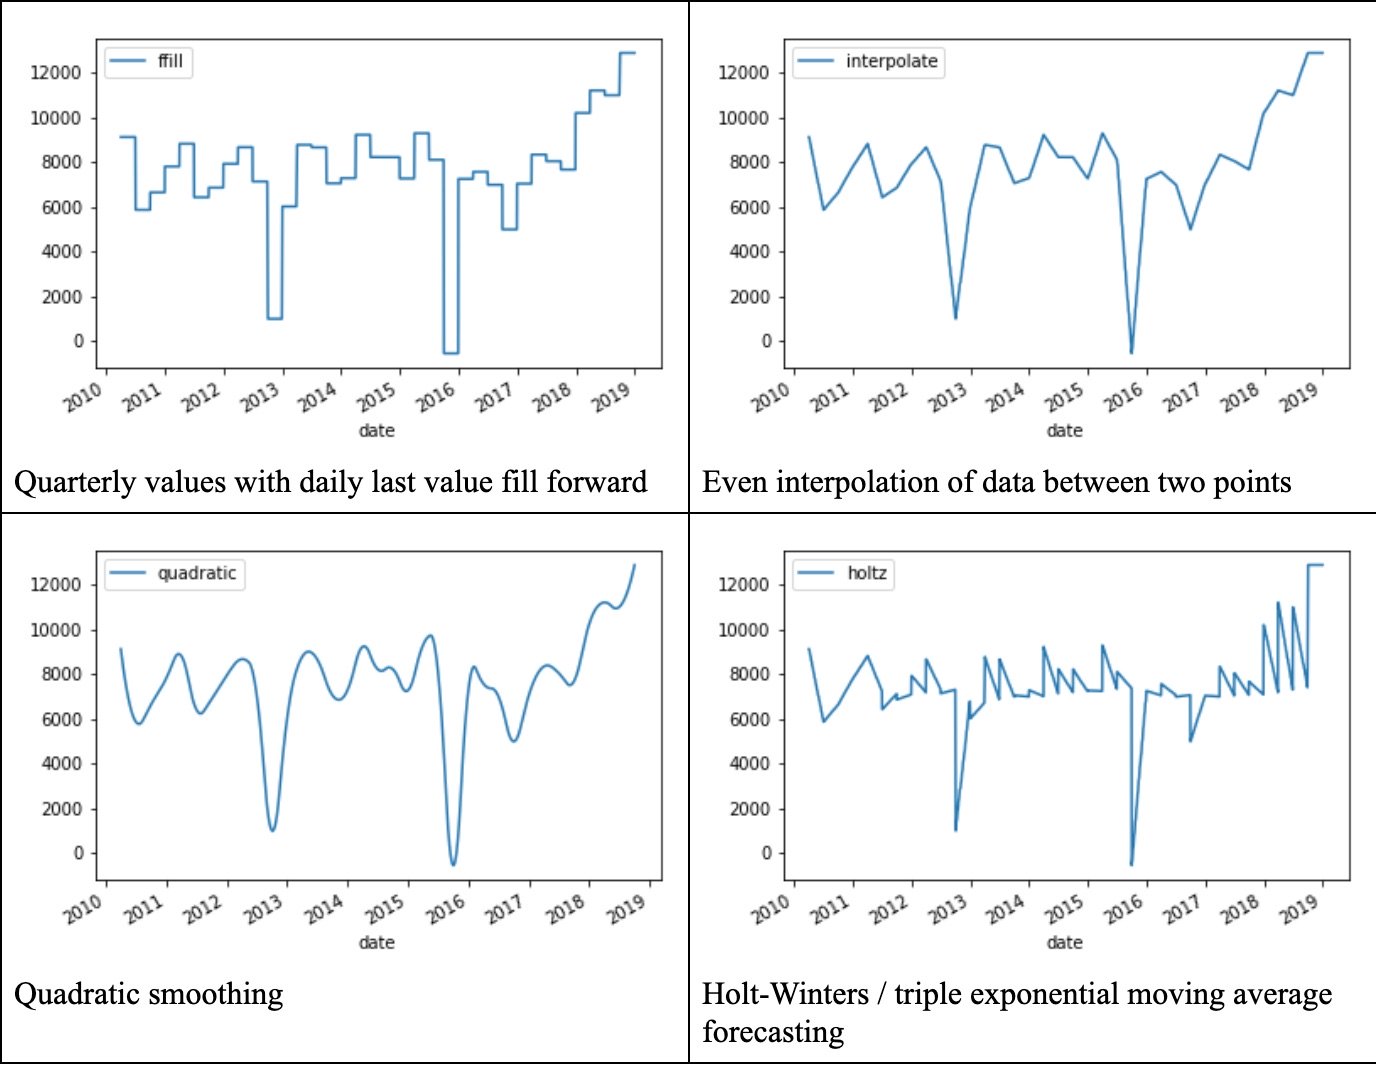
For example, if we wanted to interpolate or extrapolate the daily values between two quarters, below are several common methods, listed in order of efficacy:
Naive: Carry forward the last known value each day until the next quarterly value is published.
Interpolate: Divide the values between two adjacent quarters evenly.
Quadratic Interpolation: Apply a formula that considers values in Quarter 1 and Quarter 2; as daily values are interpolated, the formula weights values for days closer to Quarter 2 higher compared to days closer to Quarter 1.
Curve smoothing and seasonality-based forecasting: Applying industry time series forecasting practices such as autoregressive integrated moving average (ARIMA) or Holt-Winters enables the application of smart smoothing and time series curve based forecasting.
Use simple models and stitch them together
One of the most important takeaways when applying machine learning to a scarce training set is to avoid trying to get “too cute” and deploy the latest and greatest in deep learning research.
This means favor a simple decision tree, random forest, SVM, or a logistic regression over a sophisticated multi-layered deep learning network. Deep learning infrastructure cannot learn from a small data set. It can only be effective when there is an abundance of training data.
In short, for KPIs, try and build many simple models with just a few factors. In turn, combine these uncorrelated models into an ensemble via gradient boosting. The basic principle around ensemble voting is to allow multiple weak models to vote together in order to produce a high conviction classification.
Key Takeaways for Forecasting KPI
Forecasting KPIs in advance of a final investment decision is becoming increasingly essential as it is the most reliable way to gain early insights into a company’s health and projected earnings report.
Data scarcity and staleness are the main challenges when forecasting KPIs but can be overcome with sound research practices. We have demonstrated how techniques such as ARIMA or Holt-Winters are designed to extrapolate higher frequency midpoints of Y labels for more effective machine learning research.
In addition, taking a collection of simple, uncorrelated machine learning models and combining them into an ensemble of expert voters can be the key to a successful KPI forecaster.
What’s most exciting is the practice of forecasting KPIs extends well beyond investment research. Any company that is interested in forecasting its key performance indicators, based on their internal data combined with macro or external data, can take advantage of data science and machine learning.
Want more information on KPI Forecasting? Watch “Constructing Unique Data Feeds for KPI Forecasting” or Contact Us.