Erez Katz, CEO and Co-founder of Lucena Research.
Key Concepts For Quantitative Investment Research
The rapid growth of big data has resulted in a technology and AI arms race. In the past, being an AI player would typically earn you a new level of professional esteem but big data, data science and machine learning are no longer a privilege of a fortunate few.
Complex concepts in deep learning are now more accessible than ever. As many seek to add alternative data and deep learning as an overlay to research, they are quick to realize throwing data at a deep learner is not enough to solve real-world problems. The reality is that data science is essential to a commercially sound deep learning solution but guidelines need to also be provided.
How Data Science Extracts Insights
Labeled vs. Unlabeled Data
Unlabeled data consists of observations that can be obtained relatively easily from the world around us. The data is mainly a collection of items without any classification or identification. Social media tweets, news feeds, corporate actions, sales figures, and location data are all considered in their natural form to be unlabeled data.
In contrast, labeled data is unlabeled data augmented with some sort of identification (also called classification or tagging).
Read how machine learning converts unstructured to structured data.
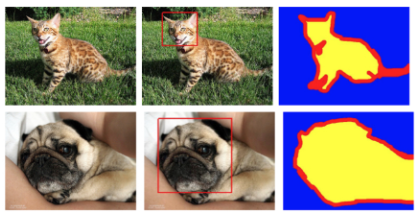
The additional information overlaid on unlabeled data is mainly human-driven, and therefore more costly and harder to obtain. For example, labeling a photo to distinguish whether it contains a dog or a cat must be informed initially by humans.
The process of deep learning is empowering a machine to infer the proper label from new unlabeled data by generalizing the relationship between the data (attributes or features) and its labels.
Machine learning is made available through “inspecting” lots and lots of labeled data in order to discern the underlying association rules. Subsequently when the machine is presented with new unlabeled data it can label it on its own with a high degree of certainty (measured by accuracy and precision).
The process of mapping and labeling raw data so that it is most effective is not simple. It requires deep domain expertise in the underlying business that sources the data. In most cases the data is not directly related to the financial markets and needs to be aggregated or arranged in a certain way so it’s most relevant to tradable securities.
Removing the Noise for Effective Machine Learning
Imagine you have a five-year history of every mobile sales transaction at Starbucks. If not analyzed and aggregated properly, even the most obvious information could not be predictive.
A natural approach would likely be to correlate total sales to Starbucks’ future stock price since strong sales will most likely drive the next quarterly earnings. However, if the sales figures are not seasonally adjusted, or not measured in the context of a change against a predetermined moving average, the information will be less exploitable by the deep learner.
There are additional hidden gems in Starbuck’s sales data that only an astute data scientist can recognize. Take, for example, aggregating Starbucks sales by geographic location or consumer demographic profile. There may by additional valuable information to infer from a positive Starbucks sales trend regarding things like consumer confidence, discretionary spending forecast, or the sales forecast of supply chain dependencies.
How Machine Learning Can Empirically Evaluate Your Data
Independently and Identically Distributed Data (IID Data)
Labeled data is most effective for a deep learner when its values are independent of each other and are similarly distributed.
The reality, however, is that most time series data (the type of data mostly used for price forecasting) is actually dependent. It is incumbent upon the data scientist to map the training data into an IID-like structure for a most efficient deep learning process.
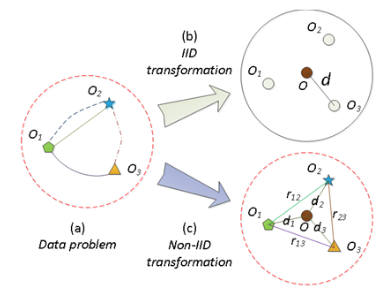
Describing a data problem in IID and non-IID format can be found below. Non-IID require multiple independent models and are naturally harder to solve.
Suppose you are investigating how heart rate can predict if someone is a smoker. You can measure BPM (beats per minute) as 30 samples of one-minute (30*1m) readings and ask if the person smokes in order to build your label dataset. What would contribute to a better predictor?
- 30 observations from one person who smokes or one observation from 30 different people who smoke? Given that one person’s heart rate won’t change much over 30m, it seems clear that you’d rather have one-minute samples from 30 different people rather than 30-minute samples from one person.
To put this in context, 30 observations from different people are independent and identically distributed while 30 readings from the same person are highly dependent. An astute data scientist should know how to map sample data into an IID format in order to provide the machine with the most conducive conditions to learning.
Is Your Data Ready for Investment Research?
The examples above provide some context into what it takes to make alternative data and deep learning jive by layering in data science.
The question remains: how do we incorporate growth in machine learning to forecasting asset prices?
Data must go through a thorough and robust journey of validation, enhancement and testing before it can form the basis for an investment strategy.
Once your data has been vetted and enriched with feature engineering you’re ready to test incorporating a quantitative overlay into your investment strategy research.
Is your data predictive? Here is a behind the scenes look into our data validation process for investment decision research.