Erez Katz, CEO and Co-founder of Lucena Research
Prattle applies natural language processing on central banks’ communications in order to extract macro level sentiment scores on countries, industries and sectors worldwide.
Through our partnership, we’ve recently conducted extensive quantitative research on Prattle’s data and have uncovered quite a few actionable investment opportunities. Here is how unstructured communications are turned into structured data from which intelligence for strategies can be easily derived.
Structured Data from Unstructured Communications
Prattle has expanded its offerings to include two additional corporate specific sentiments. One based on earnings calls and the other spans almost all aspects of a corporation’s communication data.
Similar to macro-level sentiment, Prattle can now identify equity level sentiment from these two additional sources of unstructured data. Specifically earnings call transcripts (which also include Q&A sessions following the earnings calls) and also corporate communications which includes; press releases, investor days, officers speeches and other communications on corporate websites.
By applying natural language processing (NLP) and other advanced techniques in machine learning, Prattle was able to quantifiably score a particular corporation’s sentiment.
What Is The Difference Between Structured And Unstructured Data?
Structured data refers to digitized information with a high degree of organization in a readily searchable format (for example, time series data that can be expressed in rows and columns).
Unstructured data is essentially data that is not easily searchable such as verbal communication or free text. This lack of organization makes deriving intelligence from such data both time consuming and a costly endeavor.
Prattle Corporate Communication-Based Sentiment
Lucena was tasked with two main goals:
1) Validate Prattle’s equity sentiment through its earnings call and corporate communication data historically.
2) Enhance Prattle’s core expertise by introducing additional complimentary machine learning-friendly features.
As we have done with other alternative data sources, we followed our regimented data integration process in which we have automated many of the most time consuming, mundane tasks.
Lucena’s Data Integration Process
First we loaded Prattle’s historical data set into the Data Qualification Engine and analyzed for consistency, completion, survivor bias, anomalous dates, and how their signals are distributed across their corresponding constituents universe. More importantly we’ve analyzed the correlation between meaningful changes in Prattle’s sentiment scores and their corresponding assets’ future price actions.
We then created additional features derived from Prattle’s native signals (a process often referred to as ‘Feature Engineering’) in order to enable our machine learning disciplines to further hone in on the most predictive set of features for specific constituents and market regimes.
Below is a backtest conducted on QuantDesk® that identifies which features (both Prattles’ native features and Lucena’s featured engineered features) are most suitable for the Dow 30.
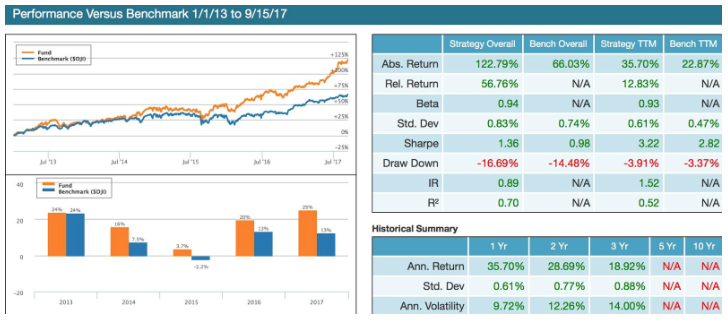
Prattle DJI Long backtest simulation between 1/1/2013 and 9/15/2017. Past performance is not indicative of future returns.
Prattle DJI Long is predicated on two Prattle earnings calls score indicators:
● The Average Score Value is the rolling simple average of earnings call scores over a 252-day period.
● The Score Difference Rank is the difference between the most recent earnings call score and the preceding earnings call score (as long as it not older than 252 days), then ranked against the Russell 1000.
A buy signal occurs when stocks in the Dow conform to both indicators. Positions are held in the portfolio as long as they continue to conform to both indicators. When one or the other indicator is no longer active, a sell to close signal occurs.
Combining Prattle’s Data With Traditional Fundamental and Technical Data
In addition to evaluating a strategy utilizing Prattle’s data exclusively, our technology is capable of identifying indicators that when used together with Prattle’s can provide even greater forecasting capabilities.
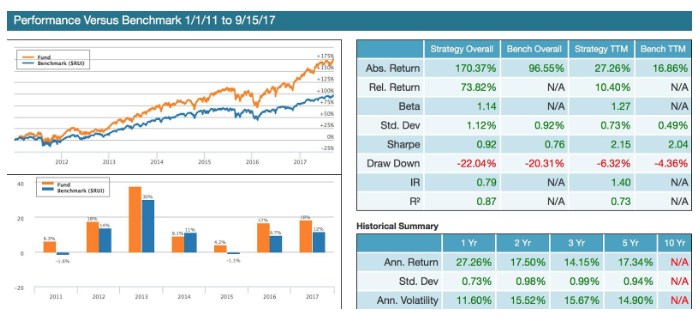
Prattle Comm Long backtest simulation between 1/1/2011 and 9/15/2017. Past performance is not indicative of future returns.
Prattle Corp Comm is a long-only backtest that demonstrates the efficacy of applying machine learning to create a multi-factor model based on Prattle’s corporate communications sentiment combined with fundamental and technical data.
The backtest trades daily based on a conditional scan. Every day the system scans the Russell 1,000 and searches for stocks that meet a multi-factor scan criteria. Including:
● Beta Rank (how an asset Beta is ranked against its peers)
● Free Cash-flow Rank (how an asset’s Free Cash-Flow is ranked against its peers)
● Prattle Most Recent Sentiment Score (Prattle’s asset sentiment score)
The stocks that met the scan are then equally weighted based on a predetermined daily allocation and cash allowance. The positions stay in the portfolio as long as they continue to meet the scan criteria.
The concept of holding stocks conditionally vs. predetermining an arbitrary hold time (one month, for example) allows for a more dynamic holding time based on market and stocks’ idiosyncratic conditions. The in-sample training timeframe is limited to 2010. All remaining years are completely out of sample. Transaction costs are estimated at 5 bps round trip and are netted out of the total return. Benchmark is RUI (the Russell 1000 index).
Find New Insights in Alternative Data
It’s important to note that the backtest results and the studies presented are not meant to dictate how to trade using Prattle’s data but merely designed to present empirically that the data is predictive and should be considered for inclusion in a broader research effort.
Through a well-defined data validation process, Lucena can help eliminate the guessing of when data or signals are production-ready and predictive. Our Data Analytics Suite combines unique alternative data sets with powerful machine learning capabilities to discover and capitalize on new opportunities for investment.
Want to learn more about our data validation process? Drop a question below or contact us.


