Erez Katz, CEO and Co-founder of Lucena Research
Using Machine Learning to Protect Your Deep Value Bottom-Up Portfolio
How can machine learning be used effectively to enhance human intelligence in the context of fundamental buy and hold research? A few things to review:
Elements of a Deep Value Fundamental Portfolio
- Value investing is a style of investment which focuses on specific stocks that are priced below their intrinsic value.
- Individual stocks are valued mainly based on their companies’ fundamentals and financial performance.
- Most analysts have gathered domain expertise through many years of research and intimate knowledge of very few companies which in turn serve as the basis of highly concentrated portfolios.
- The concept of quantitative analysis has been mostly foreign to deep value fundamental analysts until recently.
What Has Changed?
First, we need to give credit where it’s due, as most deep value fundamental managers have been spot on. Since the financial crisis there has been a constant flow of money away from active management to traditional buy and hold traditional instruments.
However, many portfolio managers recognize that markets can’t continue to climb forever and are growing nervous that our bull market is running out of steam. Many still hold a strong conviction in their portfolios but are seeking protection from an inevitable pullback.
In addition, traditional analysts are recognizing that there is a big data evolution unfolding and are looking for ways to incorporate data science into their traditional research.
Machine Learning Portfolio Optimization
Lucena’s QuantDesk Hedge Finder is geared to protect a portfolio from major pullbacks by introducing additional assets that together form an anti-correlation trend line against the portfolio’s core holdings. The technology underneath the Hedge Finder is a sophisticated machine learning pattern-matching technology, but QuantDesk makes it easy to deploy by simply following a few short steps.
Machine Learning Deployed
Below I have arbitrarily constructed a bottom-up portfolio of some of the most widely held stocks from the Dow 30.
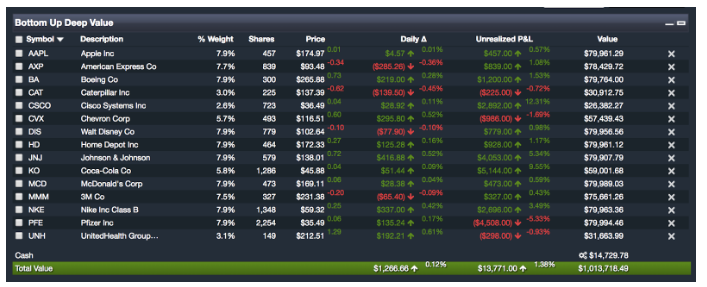
Using the Hedge Finder we can identify a set of additional constituents from the S&P 500 that when added to the portfolio will preserve its trend line while reducing volatility. QuantDesk is unique in that it gathers only the basic information and upon execution forms a deep grid search in order to identify which configuration produces the best outcome.
For example, rather than needing to select the look-back period (the period that the machine gathers historical information from in order to make its predictions, also called the training period), QuantDesk tries a sequence of look-back periods in order to identify which works best.
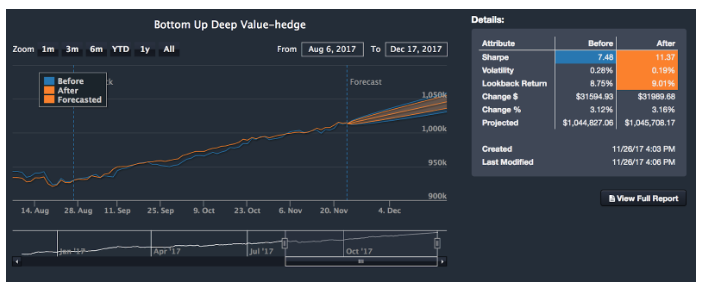
In the Hedge Finder output, you can see the blue line represents the original portfolio while the orange line represents the hedged portfolio. To the right of the vertical line is the before and after portfolio’s projected performance cone for the upcoming month. On the right, you can analyze the before and after statistics.
As you can see the areas highlighted in orange are the metrics that the Hedge Finder was able to improve. Specifically, higher Sharpe, lower volatility and even a slightly better return during the look-back period.
From here we can easily validate if the hedging method works out-of-sample on time periods that have not been analyzed in the past.
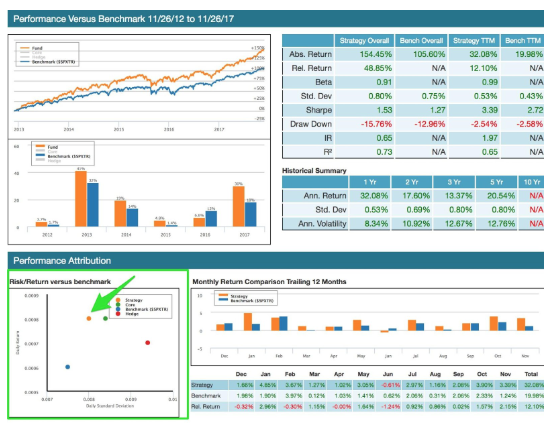
Past performance is no guarantee of future returns. The backtest simulates rolling back time and demonstrating how the Hedge Finder actually works over an extended timeframe in the past.
QuantDesk features a comprehensive backtest performance report. Here, you can see how our hedge portfolio performed against its benchmark $SPXTR (the SP total return benchmark). In addition, you can see in the scatter plot chart (marked in green on the bottom left) how the hedged portfolio indicates lower volatility for a higher return against the benchmark.
Now you’re ready to convert your backtest into a forward-traded live strategy and deploy your findings. By pressing a single Go Live button, the same rules of the backtest can be tested perpetually on a roll forward basis.
Protect Your Portfolio
Hedging and backtesting using Machine Learning technology enables the protection of any portfolio without disturbing its core holdings. Lucena’s hedging technology enables advanced pattern matching technology suited to identify what other securities (from a predetermined list) will provide the best protection for a given risk tolerance.
Want to learn more ways machine learning can protect your portfolio?