Erez Katz, CEO and Co-founder of Lucena Research
In early 2018, I published several articles followed by a webinar on applying convolutional neural network (CNN) to stock forecasting. Over the course of many months, our Quants perfected the process of validating and integrating big data into machine learning-based KPI and stock forecasting. The novelty and state of the art technology of CNN has proven valuable, now we are excited about taking our computer vision approach to the next level.
Here I will provide a high-level description of our machine learning research process and how it has evolved. I will then describe what are the limitations in a traditional CNN approach, and why Geoffery Hinton’s Capsule Network addresses most of these limitations and consequently lead to higher conviction KPI forecasting and stock price action classification.
Stock Forecasting Using Deep Learning and Computer Vision
My initial inspiration to apply deep learning computer vision to stock forecasting stemmed from the great success CNNs have had with image recognition. Applying CNN for image classification is a state of the art algorithm that’s based on breaking down a complex image into the sum of smaller pixelated spatial representations. This breakdown is necessary for generalizing (through numerical approximations) the distinguishable characteristics of features within an image.
To get slightly more technical, by feeding many labeled images into a CNN network (an image and its corresponding name, i.e. an image of a dog associated with the label “Dog”), it is able to generalize the common characteristics that associate an image with its corresponding label. The CNN classifies through low dimensional feed-forward layers of neurons, each composed of sequence of weights per pixel or per sum of pixels in the image.
Image 1: A fully connected network classifier Animated gif by James Loy.
A convolutional process extracts features through filtering. By extracting the features of many thousands of images of dogs, for example, the network learns over time through a feed-forward and backpropagation process how to classify a Dog based on common distinguishing characteristics (ears, mouth, tail, etc).
The feed-forward and back propagation processes allow the network to self-adjust the weights of the pixels (or neurons) sequentially, one layer at a time, in order to get as close as possible to the desired numerical representation of the label, “Dog.”
This self adjustment process is based on a mathematical approximation of error reduction between the network output and the desired output. Ultimately, when a new image of a dog is fed into the network, these very characteristics — ear, nose, mouth, tail etc. — are identified and the association with the label “Dog” is ascertained with high confidence.
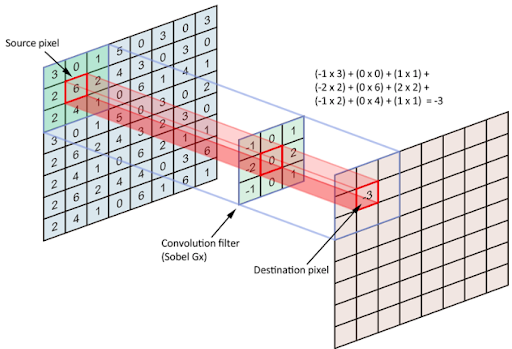
Image 2: A convolutional process of the pixelated representation of an image.‘ The filter slides over the input and performs its output on the new layer’. Source
The commercialization of the above process among other deep learning neural network disciplines is mostly attributed to Yann LeCun, and Geoffrey Hinton (who is largely responsible for popularizing of backpropagation and gradient descent). These two Turing award recipients are considered to be the founding fathers of artificial neural network (ANN).
How Can CNN be Used for Stock Forecasting?
It is rather intuitive to see the similarities between classifying images of objects, and classifying images of time series graphs for an impending price action.
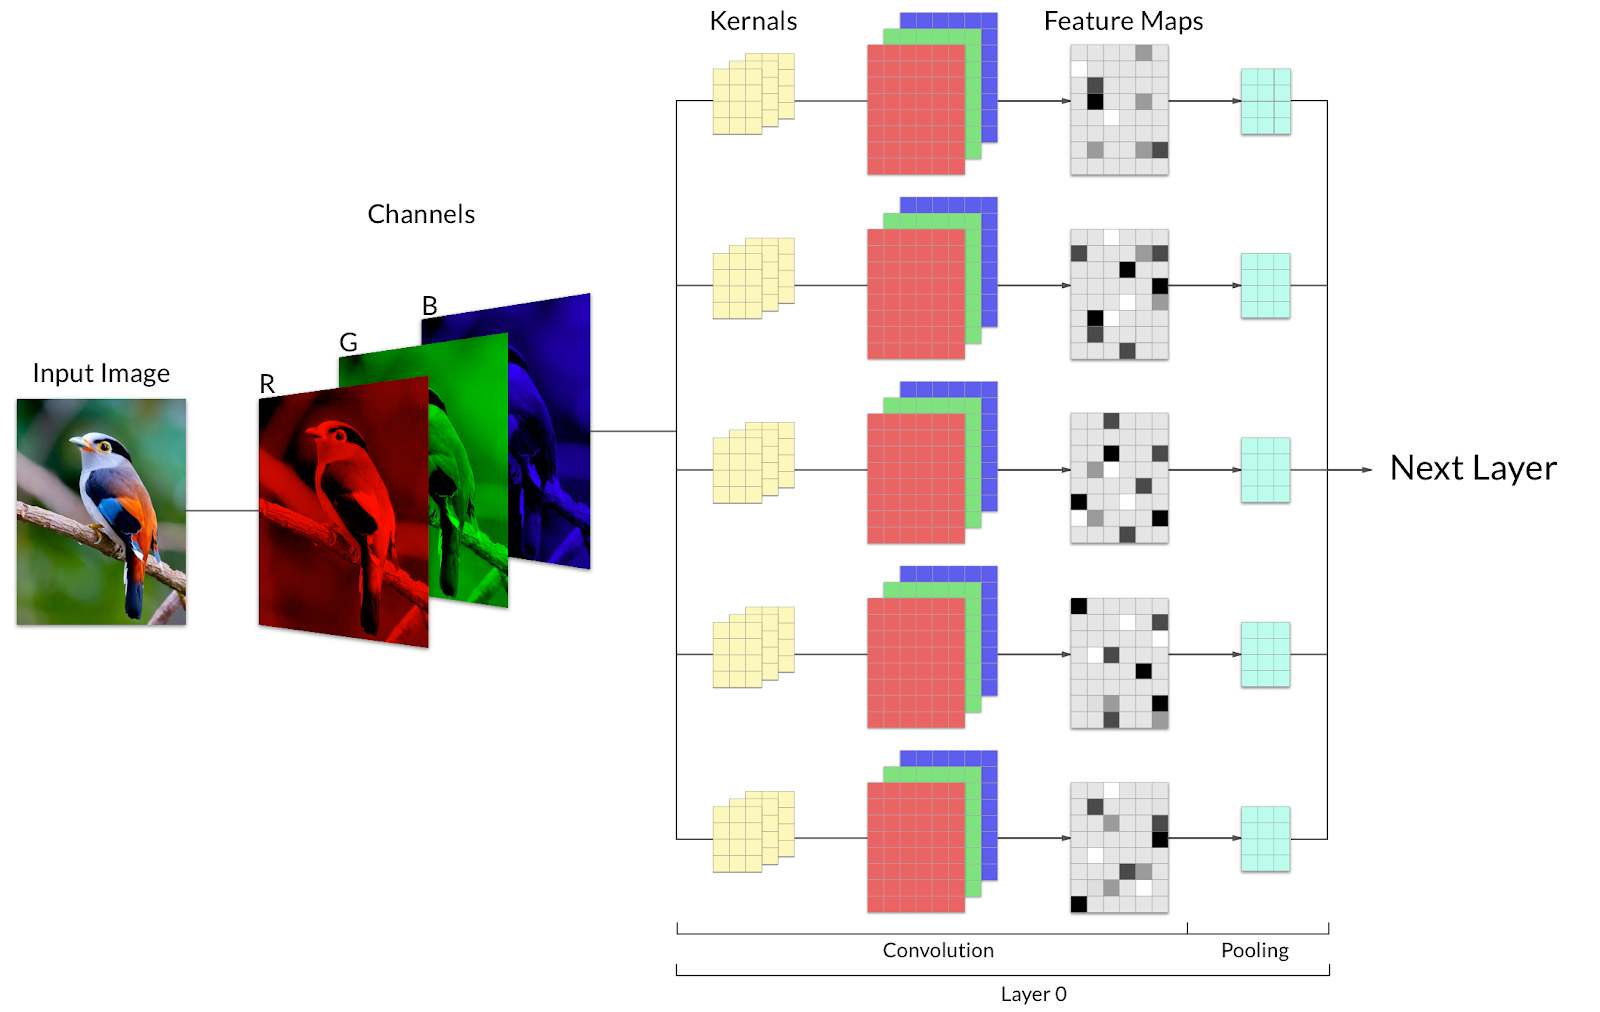
Image 3: A bird broken down to three channels R,G,B before being fed into the convolutional classifier.
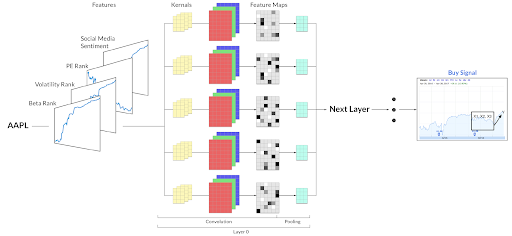
Image 4: A multi-channel representation of time series images before being fed into a CNN for a labeled classification (buy or sell).
At Lucena, we took it upon ourselves to fully implement the above vision. First we convert different time series into images. These images represent a particular period of time. For each time period we stack images from different datasets to create a multichannel image. CNNs are then trained on these images historically to extract features corresponding to buy or sell classifications.
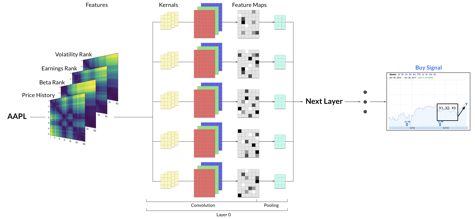
Image 5: Multiple time series trends converted to two dimensional images overlaid together as multiple channels and fed into CNN for a Buy or Sell classification.
We’ve iteratively perfected our process of data ingestion, data validation, normalization, feature engineering and constructing predictive models using CNNs.
To provide richer data representation of time series, we convert a typical time series graph to a multidimensional representation using RP (Recurrence Plot, as demonstrated below).
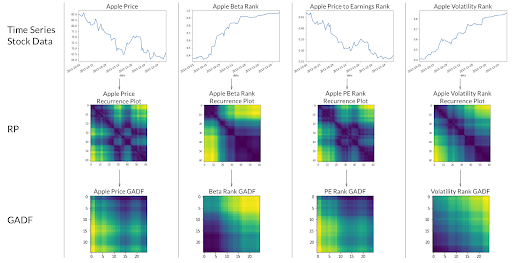
Image 6: Using recurrent plot (RP) or Gramien Angular Difference Field to transform time series image to richer uniform image representation.
Overall, the process has yielded decent results. Amazingly, the classifiers can indeed identify which combination of features (time series trends) can yield a high conviction classification as follows:
- Binary (buy (1), sell or do nothing (0) ) or
- Three State Classification (buy (1), do nothing (0) , or sell (-1) )
The backtest below is completely out of sample and simulates the process described above for a three-state-classification using a long/short portfolio.
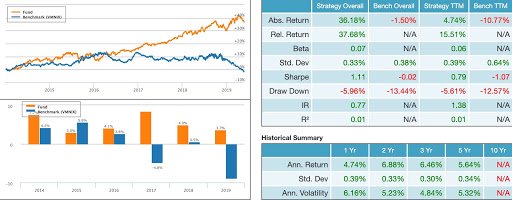
Image 7: Out of sample backtest of three state (1 buy, 0 do nothing, or (-1) sell short) classification using CNN with RP (two-dimensional images). The model portfolio is marked in orange while the blue line represents a long/short market neutral benchmark (VMNIX – Vanguard Institutional Market Neutral fund).
Past performance is not indicative of future returns.
Can We Do Better?
It turns out that with all the excitement around the novelty and the state of the art technology, we forgot to measure if this process is indeed superior to traditional machine-learning classifiers such as SVM, linear regression, gradient boosting decision trees, etc. Indeed, in many cases the deep learning CNN classifier didn’t yield dramatically superior results to other simpler and less resource consuming classifiers.
What gives? We looked deeper at the inner mechanics of CNN, with two overarching questions in mind:
- How different is CNN in storing and classifying images compared to humans?
- How come babies can classify new, never before seen images with just a few short observations?
It turns out, that in spite of the incredible success that CNN had commercially, the technology still presents serious flaws.
One main flaw of CNN is the loss of important information through the use of Max Pooling. Before one layer of neurons passes information to a subsequent layer, it uses an approximation representation method called Max Pooling. More specifically, Max Pooling represents multiple neurons with a single value based on the neuron holding the strongest scalar intensity.
This process of approximation helps the engine generalize the most distinguishable features so that when the classifier identifies a similar (rather than identical) feature it can realize such similarity. However, this process of generalization often causes loss of critical information.
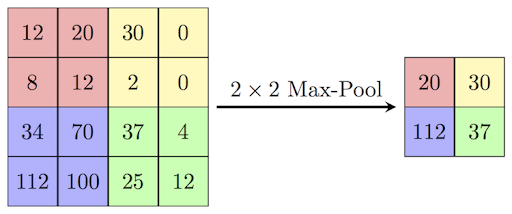
Image 8: Max-pooling is used to down sample features within an image to enable easier generalization and faster processing.
It is also worth mentioning that max-pooling can also makes the classification process vulnerable to adversarial pixels. To state simply, by injecting just a few adversarial pixels into an image. In essence one can easily fool a CNN network to misclassify an image as something completely different from what it was intended. Just imagine how devastating it would be for autonomous vehicles if they misclassify a stop sign as a max speed limit sign. To the naked eye both images will look identical.
One other flaw of traditional CNN is that it lacks the ability to contextualize the positions and the relationships between features in an image.
Passing The Picasso’s “Portrait of woman in d`hermine pass” Test
Inspired by Picasso’s famous painting, a question should be asked: How would a CNN treat a heavily distorted image of a face?

Image 9: Picasso’s “Portrait of woman in d`hermine pass” image. Source
Take, for example the scenario outlined below. The image on the right is certainly not a face, although it contains all the spatial features of a face. It is highly likely that both images below will be classified similarly as a face by a traditional CNN.
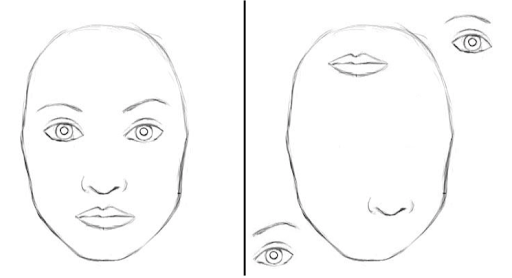
Image 10: Invariant classification of a traditional CNN both images will be identified as a face while the CNN ignores where the features are presented relative to each other. Source
A traditional CNN does not preserve the contextual proportional relationships of objects within an overarching image. Applying this shortcoming to stocks, or more specifically to time series forecasting, these shortcomings can really come back to haunt us, in the form of misclassification of time series images. In the example below, a traditional CNN would detect an upwards trend inflection but it wouldn’t be able to contextualize if the inflection trend is early or late in the cycle.
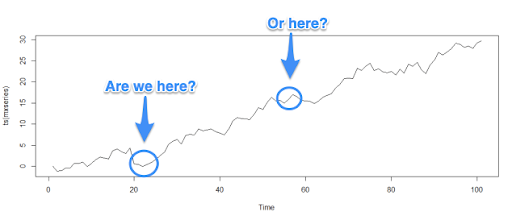
Image 11: Invariant classification in a trend analysis using traditional CNN. Both uptrends inflections will be considered equally by the classifier.
Geoffrey Hinton’s Capsule Network To The Rescue
To overcome the drawbacks of CNNs, Goeffrey Hinton designed the Capsule Network, which is still based on the same principles of multi-layered image segmentation of CNN. Capsule Network, also called CapsNet, is predicated on grouping neurons together and training the group as a single unit. By contrast, a traditional CNN trains neurons individually.
What is a Capsule?
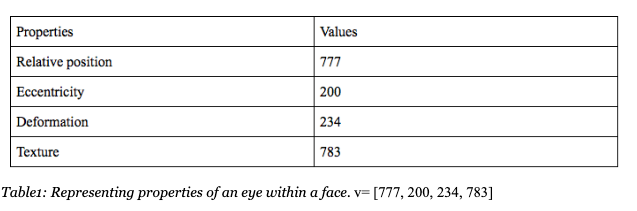
A capsule is a group of neurons with common properties pertaining to the features extracted from an image. These properties can include position, orientation, size, deformation, texture, hue, etc. The capsule’s attributes are represented in a vector.
During training, the network stores and updates weights corresponding to these properties using backpropagation and gradient descent. Error is minimized between a suggested class label and the actual label just like a traditional CNN. The length of the capsule’s output vector corresponds to the probability of a feature being present in within a higher-level feature or ultimately within the image as a whole.
For example:

For training purposes, the vector is represented by a single number but since this value can vary substantially between images, it needs to be confined to a probability range between 0 and 1.
More specifically, since we aspire to train a model by feeding many images holding similar properties using gradient descent and backpropagation, we need to squash the vector length values to be between 0 and 1. This squashification process becomes useful to prevent a known machine-learning adverse phenomenon of exploding gradients during backpropagation.
Looking at the distorted face example above, a traditional CNN will classify the likelihood of a face by looking at the features in isolation and adding the odds (probabilities) into a full image classification score (0.95).
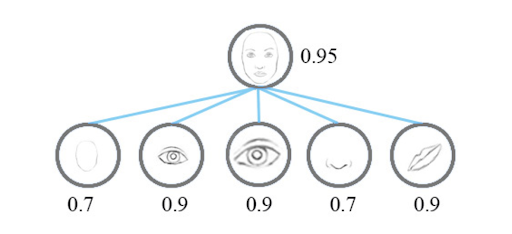
Image 12: Showing CNN representation of features using scalar output. Source
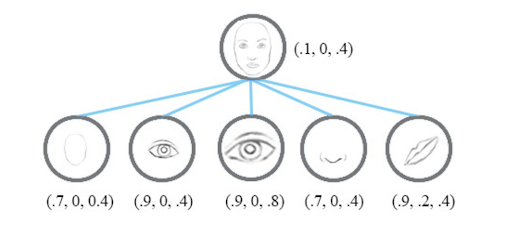
Image 13: Showing CapsNet representation of features using vector output. Source
Contrary to CNN, a Capsule Network will look at the features based on their shape and descriptive vectors (position, size, orientation, etc) relative to the image they are embedded within, and will classify the distorted face image with a much lower matching score against a full face labeled image.
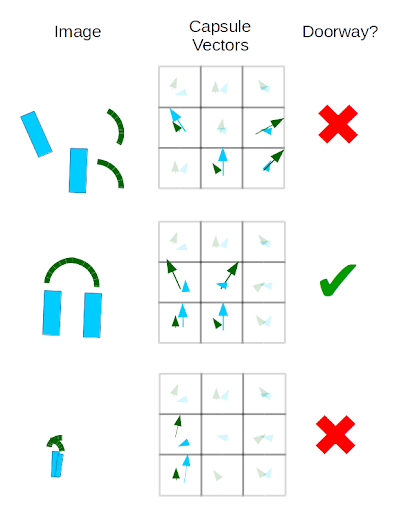
Image 14: Capsules detecting doorway from related features. Source
As can be seen, with Capsule Network (the image above), the classification is much lower on the distorted feature for a doorway classification.
How Does a Capsule Network Learn?
This section will be a bit technical and for the non-coders or quants, feel free to skip to the next section (“Experimenting with Capsule Networks”).
Think about a capsule network as a framework of hierarchical layers of high-level features broken down to sub-features in subsequent layers. When a new image is classified, a high probability path is formed as the engine traverses through the layers looking to identify the feature with the highest affiliation probability to a parent feature within a higher layer.
In order to learn the hierarchical relationship and use the properties stored in vector output, Hinton developed a dynamic routing mechanism (also called routing by agreement). Routing by agreement forges the optimal path that reconstructs smaller features into images. Starting from a lower level capsules up the chain to higher level layers of capsules and all the way to the output layer of the overarching image.
More specifically, the process works as follows:
- The input to a layer of capsules is the weighted sum over all prediction vectors from a lower level layer.
- During training, we optimize these weights through backpropagation & gradient descent along with coupling coefficients, which are refined after each iteration of routing.
- Low level features like eyes, nose and mouth along with their properties such relative position, angle, deformation, and color, vote together to hone in the highest probability that the feature is present in a high level feature, the image of a face in our example.
- The voting and refinement is an iterative process which repeats until a clear high probability distinguishable score is reached.
- Each iteration reinforces a particular path to a parent feature, if the output of subsequent layer is in agreement with that feature. Hence the name Routing by Agreement.
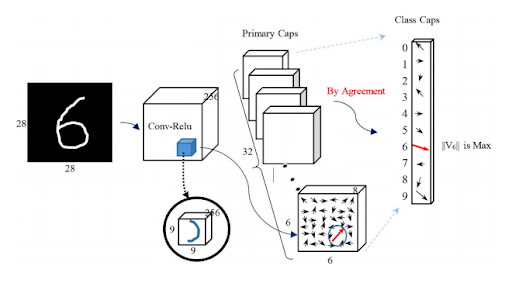
Image 15: Visualization of Routing by Agreement. Source
How was Regularization Performed?
Hinton introduces an interesting concept, inspired by the human visual cortex. By which the network attempts to reconstruct the image from the capsules structure. The reconstructed image is then evaluated against the original image in order to further minimize the loss or better yet prevent overfitting.
- The activity vector of capsules, which correspond to prediction probabilities for each class, are used to reconstruct the input image.
- Reconstruction is done by minimizing the sum of the squared differences between outputs of logistic units from a separate decoder neural network, and pixel intensities.
- The amount of regularization is controlled by weighting the loss function with an alpha parameter. Hinton used a modest coefficient of 0.0005 for regularization on the MNIST digit dataset.
- The output of the final capsule layer is fed into a decoder neural network consisting of three fully connected layers (in Hinton’s case) that learn to model the pixel intensities of the original image.
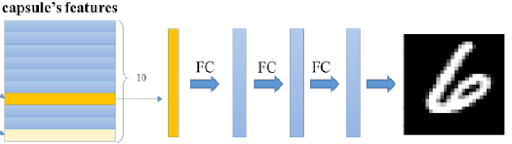
Image 16: Visual Reconstruction for Error Minimization. Source
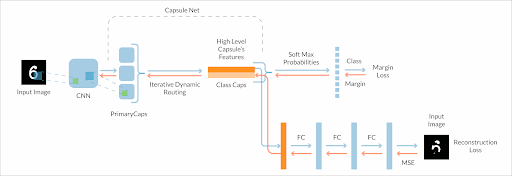
Image 17: CapsNet architecture with reconstruction loss assessment.
Experimenting with Capsule Networks
The concept of applying CapsNet to multi-time series image classification makes a lot of sense for us at Lucena for two main reasons:
- Hinton has already demonstrated state-of-the-art results using the MNIST handwritten digit recognition, even exceeding the accuracy of traditional CNNs. We view time series trend images as equal to MNIST images from complexity standpoint.
- Time series images are not subject to pose orientation variance since all time series graphs are horizontally situated with a time scale on the X axis and some scalar value on the Y axis. Therefore the CapsNet really only needs to solve one problem for us. Identifying the feature sequence positioning within the construct of a grander trend graph. A much simpler problem to solve compared to a full scale complex multi-object image.
We’ve initially conducted two experiments to evaluate the feasibility of applying capsule networks to financial data. In the first experiment we used our good old sine wave time series function. We then applied to the sine wave time series dataset our recurrence plots transformation to generate two-dimensional images. We naturally subdivided our sine wave data so that it can act as a stock price trend where we can train a model as if it represented a price sequence of a tradable asset.
Our results are shown below:
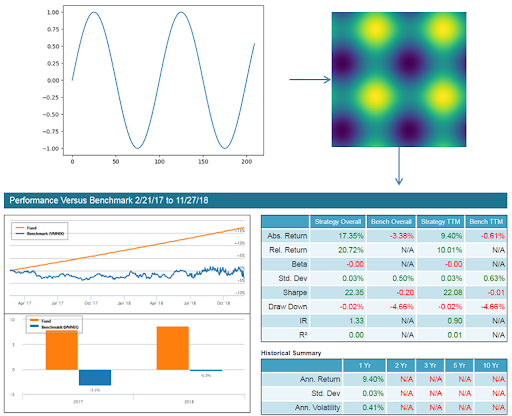
Image 18: Image of data transformation and backtest results for Experiment 1. Orange line is our synthetic trading strategy using the sine wave entry long/short/do nothing signals. The blue line represents a long/short market neutral fund (VMNIX).
As can be seen the capsule network performed extremely well as demonstrated by the backtest featured above. “But wait!” a concerned reader might exclaim, “Modeling a sine wave will be of little help when predicting in the domain of noisy financial data”. Indeed this is true. The main purpose of the aforementioned experiment is to verify that a capsule network can work successfully with one dimensional data that is transformed into recurrence plot images.
In the second experiment we dip our proverbial toes into the realm of noisy data. This experiment is very similar to the first except gaussian noise was added to data points generated by the sine function. An example of the effects of noise on the underlying signal and resulting recurrence plots can be seen in the figure below. Additionally, the presence of noise causes a degree of randomness in the labels associated with each recurrence plot. In other words, the gaussian noise could cause two recurrence plots with the same underlying sine wave segment to have different buy / sell labels for the desired future action.
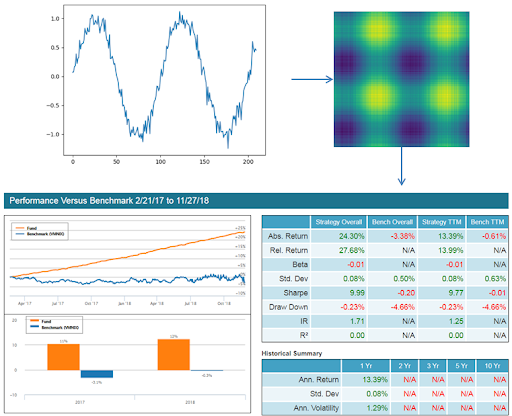
Image 19: Image of data transformation and backtest results for Experiment 2.
Once again the capsule network performed excellently, thereby passing our initial “noise test”. The next step is to predict on financial data time series directly, so that the results can be compared against those produced by Lucena’s time series forecasting CNN framework. This is still a work in progress. Stay tuned for an update on this soon!
Capsule Networks vs CNNs
Capsule networks are relatively new and have not quite gained widespread adoption. Nevertheless, it’s a fascinating new technology for image classification that has already been used to achieve state of the art results in some domains. Compared to its predecessor, CNNs, capsule networks have many benefits.
The greatest benefit is the fact that capsule networks learn to model a hierarchical structure of part-to-whole relationships between the features from which higher level features are composed.
CNNs by comparison treat extracted features as a “bag of words” and do not model their interrelationships. Furthermore, the dynamic routing process and image reconstruction allows capsule networks to learn more efficiently with minimum loss of information. Traditional CNNs rely on max-pooling which discards all but the neuron of greatest significance. These benefits do come with some drawbacks.
The training process for capsule networks requires more time and CPU power than CNNs mainly due to the iterations performed during dynamic routing. As a whole, capsule networks present phenomenal potential for image classification tasks, specifically for time series forecasting.
We at Lucena are excited to further evaluate and ultimately deploy our CapsNet architecture for KPI and stock forecasting through model portfolios.
Note: I want to give credit to two quants, Tarun Bhatia and Stuart Colianni, who’ve helped me write this article. More importantly they are the ones who put concepts to code and are working hard at implementing and commercializing the above concept.
Have questions about CapsNet or using deep learning to forecast stock prices? Comment below or contact us.