Erez Katz, CEO and CoFounder of Lucena Research
It’s no secret that utilizing alternative data for investment decisions is on the rise. In the last two years alone the total spent on alternative data increased by over 150% and is expected to grow substantially more by 2020.
This accelerated growth has driven data consumers to seek efficient methods of sifting through vast amounts of data. Here are several examples of how utilizing quantitative research can help you qualify which data is best suited for further research and ultimately investment decisions.
How to Empirically Evaluate Alternative Data Through Backtest and Model Portfolio Performance
The final step in the data validation and enhancement process is an empirical study through out-of-sample backtesting and perpetual paper trading of a model portfolio. Demonstrating an alternative dataset’s effect on a portfolio (both in the past and perpetually into the future) is a compelling showcase of the data’s empirical value.
These studies by no means instruct you how to trade but merely present a compelling view of the data’s predictive capabilities in order to incorporate the signals within your own domain as desired.
Using a Backtest to Evaluate Turnover and Transaction Costs
When inspecting a backtest performance report, many focus on the obvious metrics: total returns, volatility and risk adjusted return (i.e., Sharpe ratio). Turnover is too commonly ignored, as it is an important metric for considering the strength of an active strategy.
Turnover measures the percentage of a portfolio’s holdings that changes hands during a period of time (normally measured monthly or annually). A high turnover results in a high transaction cost and therefore a portfolio that trades often, intra-day or daily for example, needs to account for a higher average daily return compared to a portfolio that trades monthly.
Learn about an innovative approach to utilizing alternative data for forecasting.
When dealing with large block trades, it becomes increasingly inefficient, and subsequently costly, to move in and out of positions. At Lucena we’ve added several references to the efficiency of a backtest you can see below. The backtest looks fairly compelling from return and Sharpe ratio perspective.
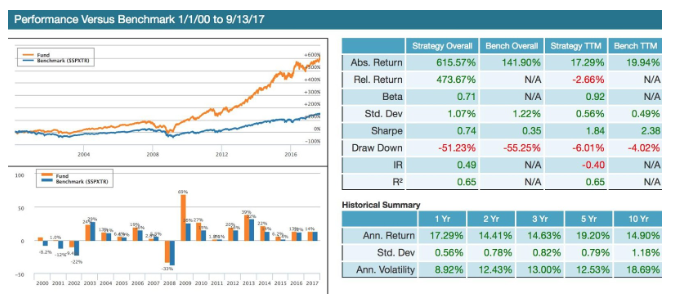
A sample backtest – 473.67% relative return above the S&P and a Sharpe ratio that is twice the Sharpe of the S&P. Past performance is no guarantee of future returns.
Below are the transaction costs and performance metrics.
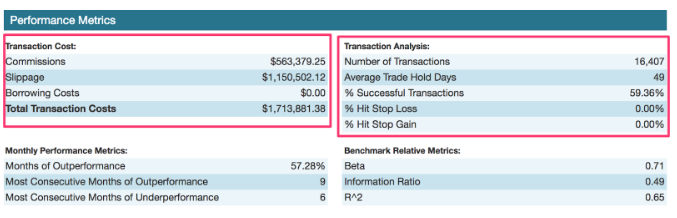
The regions outlined in red represent the transaction costs and some additional performance analysis metrics. Past performance is no guarantee of future returns.
The left-hand section breaks down the commission, slippage and short borrowing cost (which is zero in this particular long-only backtest). The right section breaks down the number of transactions and the average trade hold time, which is set to 49 days in this particular backtest. Also, please note the percentage of successful transactions of 59.36%.
Based on a 17-year backtest, the total transaction cost against the $10M initial fund size is completely reasonable. Also, the 49-day average hold time points to a compelling low-turnover backtest.
Further, let’s inspect the turnover section by month and year.
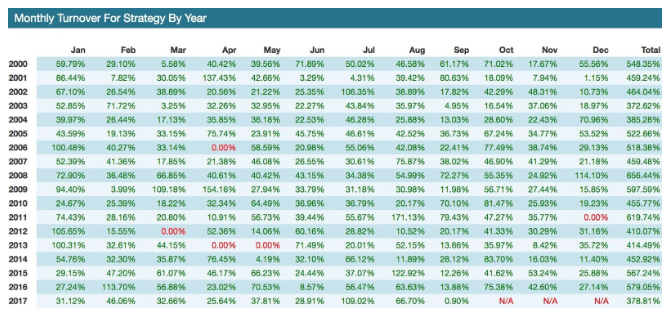
Past performance is no guarantee of future returns.
As you can see, the average monthly turnover is reasonable for an active strategy. Any number below 100% indicates that only a portion of the portfolio was traded during the corresponding month and often we witness a monthly turnover to be in single digits.
An annual turnover between 300% and 600% is acceptable for an active strategy, such as the one presented here. A more diversified portfolio is naturally more subject to small adjustments that will not materially affect the total holdings turnover.
How Alternative Data’s Value Can Be Empirically Proven
While discussing validation and deployment of alternative data, we often fail to mention how important it is to measure the predictive nature through a backtest or a live model portfolio. In order to present a compelling simulation, strict guidelines must be upheld to ensure a fair and bias free environment.
In the backtest report below, all transactions are listed for an effective audit trail. In addition, dead stocks are still considered along with slippage and transactions cost.
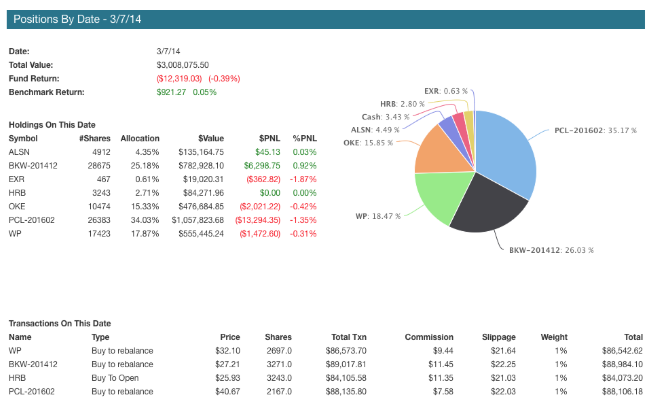
Whether you measure an active live portfolio or a backtest, the QuantDesk performance report is a comprehensive representation of a simulated portfolio in action. QuantDesk is an investment research platform that provides a wide array of performance-attribution metrics that dive deeper than traditional performance reports.
We empower our users by equipping them with all the KPIs and analyses geared to assess the quality of an alternative dataset. A comprehensive performance report that presents the results in the most complete and informative fashion is crucial to proving empirical evidence before deploying capital.
Want to know more about how we provide empirical evidence of value?
View our Case Studies.